Tag Archives: Redistricting

MD State Redistricting: Where Will Be Over or Underrepresented?

Data calculated by author.

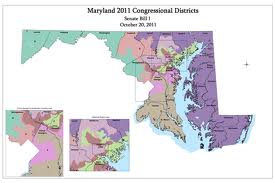
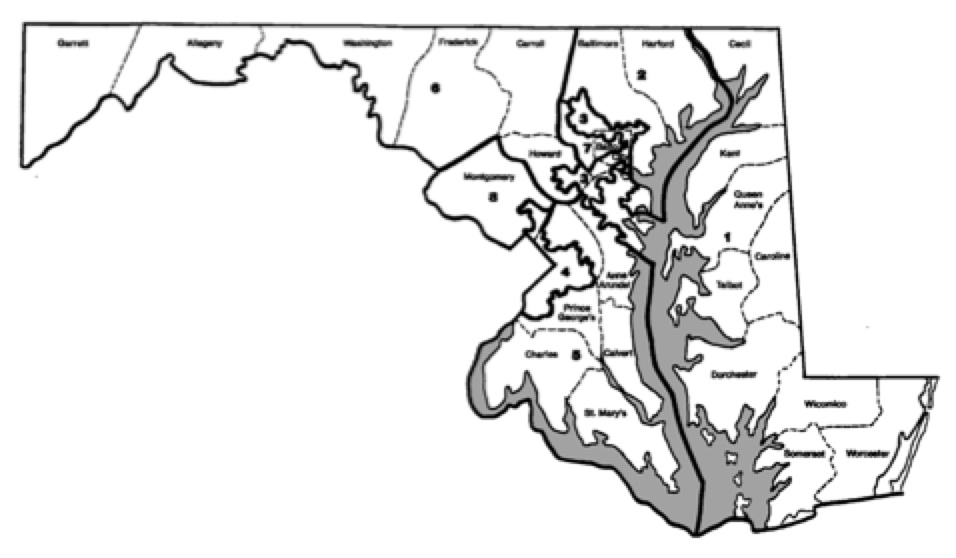
The General Assembly is moving forward with the redistricting plan recommended by the Legislative Redistricting Advisory Commission.

Redistricting in America emphasizes population equality very heavily. Congressional plans have been overturned by federal courts for unjustified deviations from population equality of as little of 20 people. Many states adopt plans in which the most populous district has only one more person than the least populous district to insulate them from challenges on these grounds.

The federal courts have usually given state legislative plans more wiggle room, though they have not always deferred to jurisdictions that meet a standard of having deviations less than 5 percent above or below the ideal population, or 10 percent total.

The Maryland plan meets the 10 percent standard but the cumulative impact of variations in legislative district size across multiple districts within some jurisdictions may raise eyebrows. Some counties are noticeably over or underrepresented compared to others.

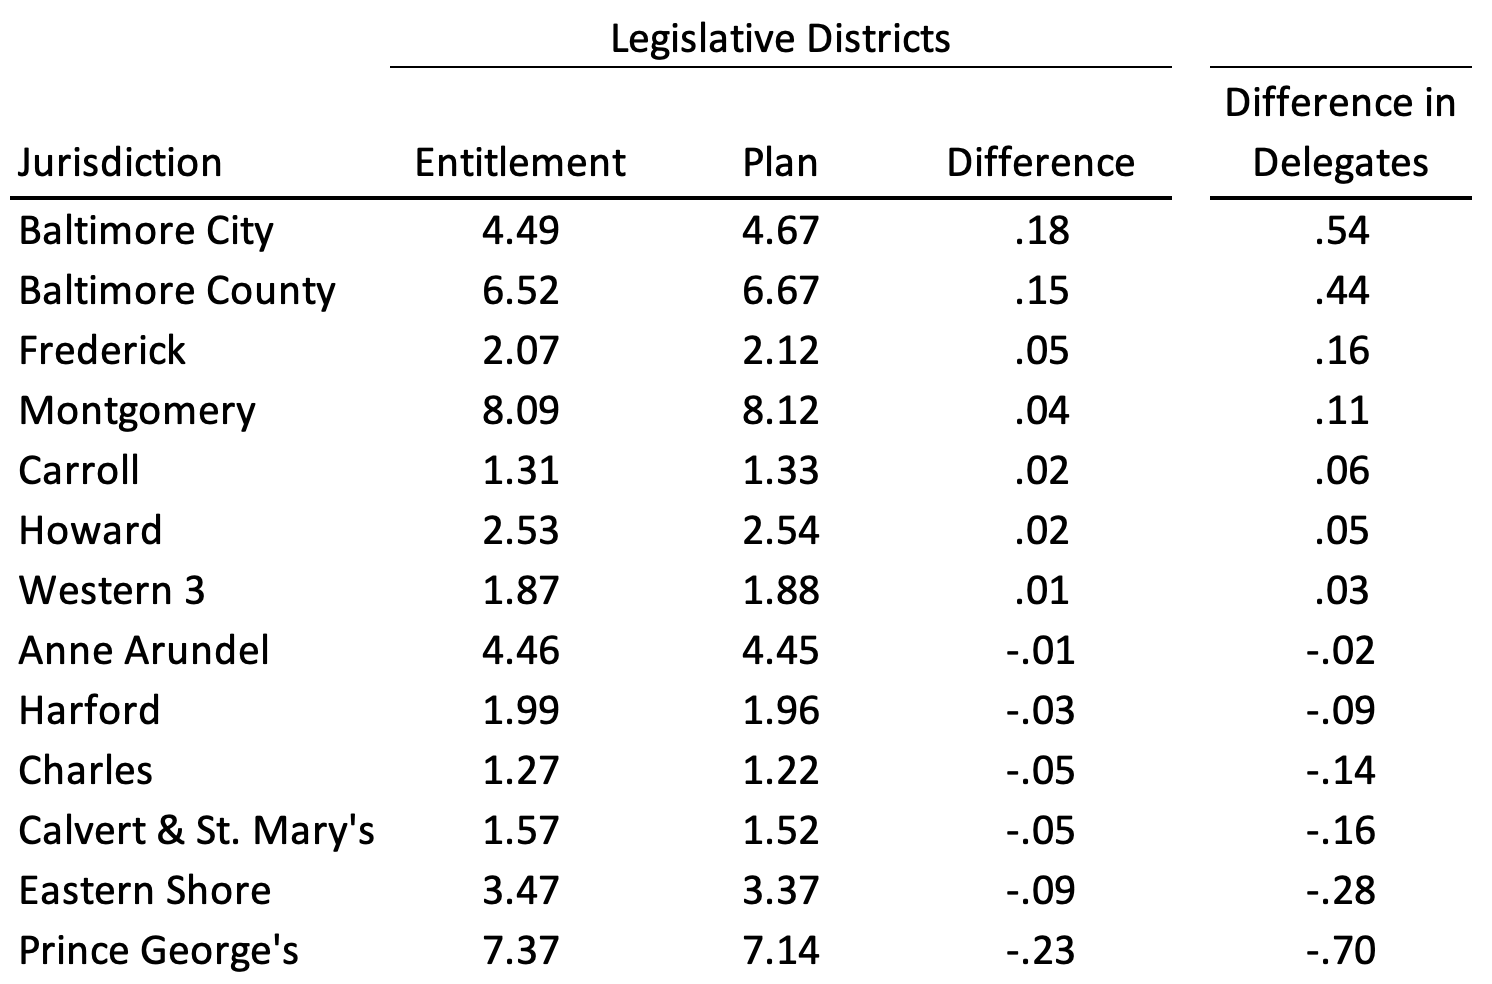
The table at the top of this post shows the legislative district (LD) entitlement of various jurisdictions based on population. Each LD elects one senator and three delegates with some divided into two or three subdistricts for purposes of delegate elections.

The table further reveals the how many LDs were allocated to jurisdictions along with the difference from their entitlement based on population. The final column shows the same information in terms of the number of delegates, which is just three times larger than for the entire LD. Where a proposed subdistrict or district spans a county line, I allotted the representation from the district based on population.

Most areas are quite close to their population entitlement, but a few areas stand out as winners and losers. Together Baltimore City and County have nearly an entire delegate more than they are entitled to based on population. Baltimore City has 55% of a delegate more than entitled to based on population while neighboring Baltimore County has 44% more.

Meanwhile, Prince George’s has 70% less of a delegate than it merits based on population. Prince George’s together with the three southern Maryland counties of Charles, Calvert and St. Mary’s together merit an additional delegate based on population. The Eastern Shore as a whole is also down 28% of a delegate.

Perhaps it is not coincidental that House Speaker Adrienne Jones lives in Baltimore County and the Senate President Bill Ferguson lives in Baltimore City. It is also part of a history of Democrats trying to protect Baltimore City from its long-term population decline.

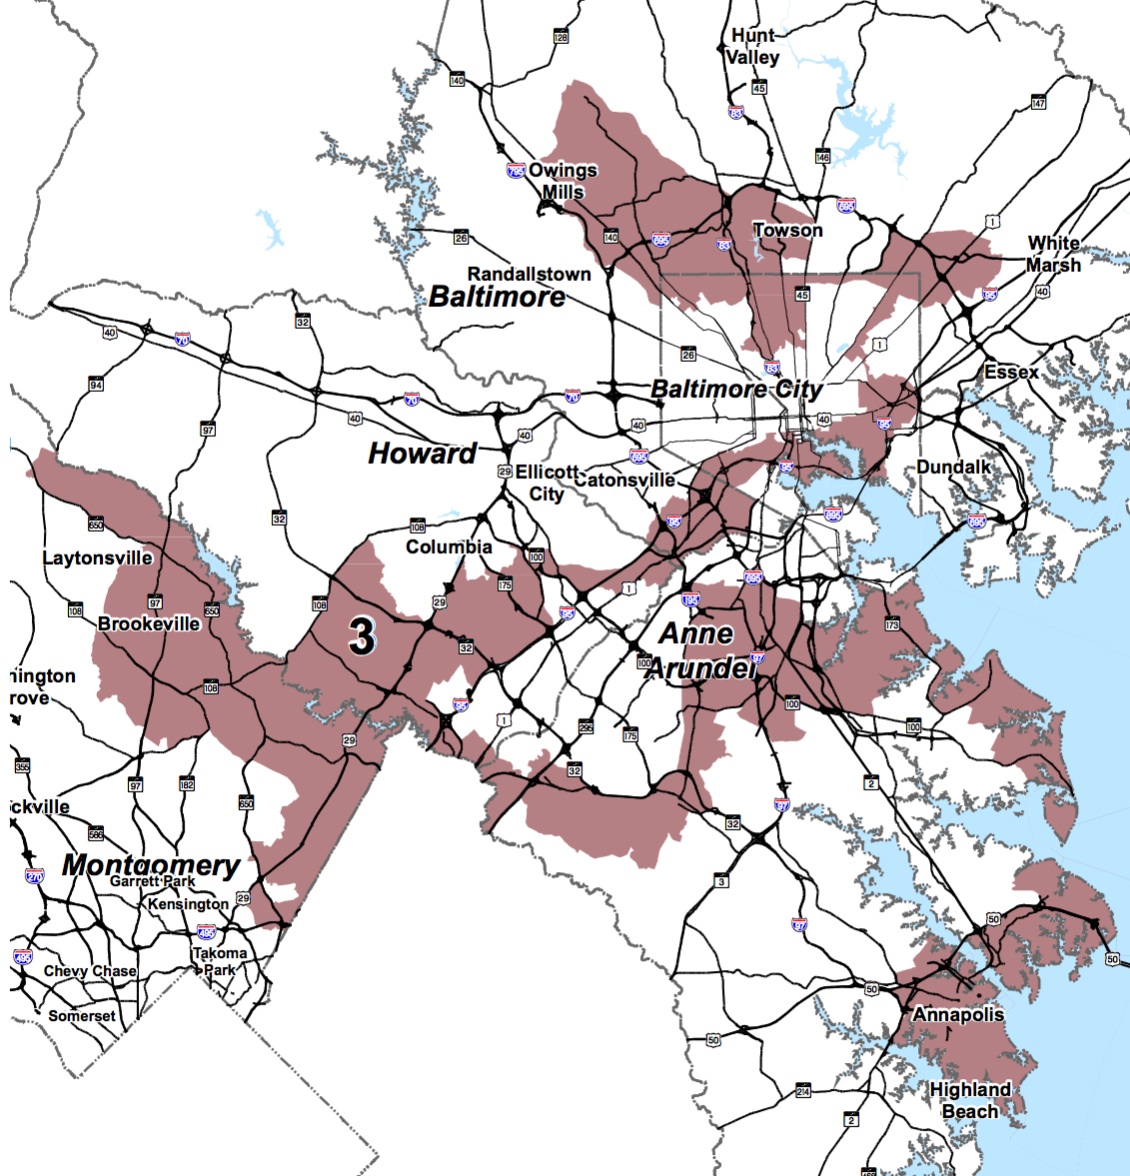
The City of Baltimore had 11 LDs in 1974 but will be down to 4 2/3 if this plan goes into effect for 2022. Past efforts to preserve City influence by extending existing City districts into Baltimore County led to the Maryland Court of Appeals overturning the 2001 map for General Assembly districts.

Share

Redistricting Plan analysis

Montgomery County’s decennial redistricting not only had to equalize populations but also had to squeeze in two new districts in addition to the existing five. The County additionally elects four at-large members.

Montgomery County Council Districts 2022-2030

All of the districts in the final plan are within 5% of the ideal district population of 151,816. At 4.7% above the ideal, the new Third (Gaithersburg-Rockville) is the most populous. But the new Second (Germantown-Poolsville) is not far behind at 4.6%. The new Fourth (Kensington-Takoma) is the smallest–4.3% undersized–followed closely by the new Sixth (Wheaton), which is 4.2% too small.

The 65% White First (Bethesda-Potomac) is the only district where a single race predominates. The 47% White Fourth and the 43% White Seventh (Olney-Damascus) are the only two other districts where a single group forms more than 40% of the population.

Whites form pluralities in two more districts–the Second and the Third–but Blacks (37%) are the largest group in the Fifth (Burtonsville) and Latinos (35%) in the Sixth. Blacks will likely comprise a much larger share in the open Fifth’s critical Democratic primary due to lopsided Democratic registration rates among African Americans.

On the other hand, the share of Latinos in the primary remains cloudier. Latinos are also disproportionately Democratic, but less so than Blacks. More importantly, immigrant communities have many non-citizens who cannot participate.

Participation rates among Latinos who are citizens is generally lower than for other groups. One reason is that eligible Latino voters skew young, as they are more likely to be citizens, and young people vote at far lower rates than older voters.

A multiplicity of Latino candidates could also split the vote. Former Planning Board Member Natalie Fani-Gonzalez and former Del. Maricé Morales are among the candidates seeking the seat. Councilmember Nancy Navarro currently represents the area.

I’d be careful not to overestimate the extent to which Montgomery voters cast ballots on racial lines. African-American Councilmember Craig Rice now represents the district with the highest share of Whites and lowest share of Blacks in the county. Both Black and Latino candidates won at-large seats in 2018.

Asians are not the most numerous group in any district. The Second has the highest share of Asians at 24%. No Asian American has ever been elected to the Montgomery County Council. Will that change in 2022 with the addition of two new districts?

Share

Top Seventh State Stories, December 2020

By Adam Pagnucco.

These were the top stories on Seventh State in December ranked by page views.

1. What Happened to White Flint?
2. The Day of Reckoning is Near
3. Jawando Calls for a Tax Hike
4. Come on Now
5. Who’s the Boss?
6. MCEA to School Board: Reopening Should be Safe
7. Trump vs Hogan: Votes by MoCo Town
8. Council Overrides Veto, Attacks Elrich, Cuts Revenue for School Buildings
9 (tie). Minority Members of the U.S. House
9 (tie). Corporate MoCo Council Adopts Supply-Side Economics

The top three stories fit together and have meaning for the new year and beyond. The Day of Reckoning is Near summarizes the county’s dire fiscal picture as it heads into a challenging FY22 budget discussion in the spring. Jawando Calls for a Tax Hike kicks off an inevitable dialogue about taxes, one which will only get hotter before the executive makes his budget recommendation on March 15. And What Happened to White Flint? – December’s runaway winner – lays out the story of how the county’s premier development plan has been held back by our slow rate of job growth. Budget headaches, taxes and economic problems are about to collide.

Welcome to 2021, folks!

Share

Come On Now

By Adam Pagnucco.

MoCo is about to embark on one of its most important tasks of the decade: redrawing county council districts. The county’s charter mandates redistricting every ten years in line with the release of new U.S. Census data. The charter also states that the council must pick a redistricting commission to recommend new boundary lines (although the council retains the final say). The current redistricting will be particularly intense given the recent passage of Question C, which expanded the number of districts from five to seven.

MoCo’s current county council districts.

More than 100 people applied to be on the 11-member redistricting commission and 32 were scheduled for interviews. The interviewed applicants include:

1. Two former elected officials, including one who used to be a council member and has run for two different offices in the last five years.

2. Five other former candidates for office, including one who has run for office seven times since 2009. Three of these former candidates have run at least once since 2018.

3. Two political consultants, one of whom has worked for MoCo politicians, including sitting council members.

4. Two spouses of sitting municipal elected officials. Both of these officials unsuccessfully ran for higher office before being elected to their current positions. One of the spouses also ran for office, including for council in 2017-18.

5. A sibling of a 2018 council candidate who has managed multiple local political campaigns.

These are not bad people. To the contrary, most – if not all – of them have done good things and can serve the county well in other roles. But the redistricting commission is a critical body that will play a key role in designing council districts for the next decade. The importance of this exercise to county residents cannot be overstated. The public interest should be the sole determinant of redistricting. Given the fact that the public is watching how this plays out:

It would be wise to avoid the appearance of a candidate designing his or her own district for a future run.

It would be wise to avoid the appearance of a political operative designing a district for a client.

It would be wise to avoid the appearance of a commission member designing a district for a family member.

Redistricting is an official and supremely important act of county government but it’s also a very sensitive one. Many people are jaded about “gerrymandering” and the county just had an all-out ballot war over the appropriate number of council districts. I can’t count how many times I have seen the word “machine” used to describe the county’s politics this year. In this climate, it won’t take much to get people to believe the worst about redistricting, and given the recent popularity of charter amendments, who knows how far such sentiment could go.

There are plenty of qualified applicants who could do a good job and don’t have any of the above issues. Come on now, council members! Please consider them when choosing who serves on the redistricting commission.

Share

Redistricting’s Biggest Losers

The current crop of state legislators is just one year into their current term. But after next year’s session they’ll have to begin grappling with redistricting—one of the most potentially divisive issues that the General Assembly faces. The State Constitution gives Republican Governor Hogan the upper hand in theory. However, the Democratic supermajority can impose their own plan if they remain united.

Population shifts along with Maryland’s requirement to adhere to county and municipal boundaries where possible without violating the federal Voting Rights Act create clear winners and losers in the process.

Which districts are most below the ideal population for a district? Once again, Baltimore City looks set to play an evil game of musical chairs, as its districts will be below the ideal district population. Here are the districts falling shortest in population according to the 2013-2017 American Community Survey estimates:

  1. Baltimore City District 40, 86.5% of ideal.
  2. Baltimore City District 45, 90.6%.
  3. Baltimore City District 41, 91.0%.
  4. Baltimore County District 44B (2 delegates), 92.5%.
  5. Baltimore County District 43, 93.0%.
  6. Allegany/Washington Counties 1C (1 delegate), 93.3%.
  7. Prince George’s District 25, 93.4%.
  8. Baltimore City District 44A, 93.8%.
  9. Prince George’s District 23A (1 delegate), 94.0%.
  10. Garrett/Allegany Counties 1A (1 delegate), 94.8%.
  11. Prince George’s District 24, 94.8%.
  12. Allegany County 1B (1 delegate), 95.7%.

As these estimates are based on surveys conducted between 2013 and 2017, they likely indicate only 50% of the decade’s changes. Unless population dynamics change a lot towards the end of the 2010s, these areas will likely be farther below the state requirement by the 2020 Census.

When possible, Maryland reallocates prisoners back to their home last place of residence, which may aid some districts a bit but will further hurt districts where prisons are located. For example, prisoners housed at Frostburg located in District 1, already one of the biggest losers, will be allocated back to their previous residence where possible. As in past decades, District 1 will have to continue its steady march east into Washington County with Garrett’s share of District 1A declining again.

Baltimore City faces a much greater challenge. It currently has five full legislative districts along with a one delegate subdistrict. However, based on the survey, it only now merits 4.85 districts. One delegate is already gone with Subdistrict 44A the obvious nominee to take the hit.

My guess is that, even after adding prisoners back, population figures could make the case for taking one more delegate away (i.e. straddling one district into Baltimore County as now). No doubt Baltimore legislators will fight fiercely to keep the whole district within the City in the name of respecting municipal boundaries. Republicans won’t like this idea but will be ill-positioned to stop it if Democrats can remain united around a plan.

Assuming Baltimore City succeeds in staunching the hemorrhage, Districts 40 would slide west and District 41 would ooze south to eat up disappearing District 44A. Districts 43, 45 and 46 would then move west a bit into current Districts 40 and 41 to even out population across the City a bit. Other line changes could occur if, for example, a powerful legislator wants to draw the home of a possible challenger or successor out or into the district.

The fun and acrimony are just getting started.

Share

More Hogan Hypocrisy

Can we please stop pretending that Gov. Larry Hogan is a swell bipartisan guy?

Larry Hogan has been railing against gerrymandering in Maryland for some time. So it should have been an easy lift when seven Democratic U.S. House members asked him to support national redistricting reform.

Hogan turned them down flat.

If Hogan was really cared about fairer methods of drawing congressional districts, he would have said he’d be glad to do it. Or, at least, that he would be happy to support their bill for national reform if they’d support his efforts in Maryland. But not our Larry.

If you didn’t get the message, his public comments made crystal clear that Hogan only cares about redistricting reform because he thinks it will benefit Maryland Republicans. As he turned down national redistricting reform, he touted that several Democrats could “lose their seats” under his proposed reform.

This is part of a larger Republican pattern. Republicans fought redistricting reform tooth and nail in Arizona, trying to get the initiative overturned in court and then suing to overturn the plans passed by the nonpartisan commission. In Florida, a court recently imposed a new plan to overturn a gerrymander enacted by Republicans in violation of a reform initiative. Republicans have enacted congressional gerrymanders in major states like Pennsylvania, Michigan, North Carolina, Ohio, and Texas.

In contrast, Democratic California has a reformed commission system. New York Gov. Andrew Cuomo pushed through a redistricting reform that will go into effect with the next census. A rare bright spot for bipartisanship was acceptance by both parties of a reform plan for the state legislature (but not Congress) in Ohio.

Republicans like Hogan favor redistricting reform in Maryland not because it is generally the right thing to do but to gain advantage. Put another way, our governor cared enough go out of state to campaign for Chris Christie for president but he can’t be bothered to support national redistricting reform because that is a “federal” issue.

As when he threw his public tantrum to defend Trump, Hogan has shown his very partisan colors. It’s really time that the press and commentators stopped pretending otherwise.

Share

Voting Rights and Redistricting

Many people know that the Voting Rights Act can require the creation of majority-minority districts to protect minority representation. But the actual demands of the Act are often misunderstood.

The Supreme Court outlined the basics of when states must create districts designed to advance minority opportunity in a 1986 case called Thornburg v. Gingles. The case outlined a three-prong test that plaintiffs must meet in order to win a case arguing for the creation of a new majority-minority district.

Specifically, the minority group must prove that (1) it is sufficiently large and geographically compact to constitute a majority in a single-member district; (2) it is politically cohesive; and (3) racial-bloc voting usually defeats the minority’s preferred candidate.

I think of the first prong as the “is there a solution?” prong. Courts generally are not in the business of taking cases where they cannot offer relief. So if it is not possible to create a geographically compact single-member district with a group majority, don’t bother.

Of course, this still leaves room open for interpretation. For example, how compact must a district be to be deemed “geographically compact?” In more recent cases, courts have inveighed against minority districts with bizarre boundaries drawn for racial reasons–even as the Court has deemed it acceptable to gerrymander for partisan reasons.

This prong is one reason why there has been little litigation to create Asian-American majority districts. It’s just not possible to draw these districts  in most areas of the country just as it would likely be very difficult at best to create one anywhere in Maryland.

The second prong requires that the minority group tends to vote together. Obviously, 100% cohesion never actually occurs and is not needed to meet this requirement. Moreover, the level of cohesion can still vary across races.

But the basic idea is that you cannot draw a district designed to protect the interests of minority if the minority is not cohesive. For example, how would one advantage the interests of a group that splits its votes evenly between Democrats and Republicans?

The third prong is often the most critical. If the first prong focuses on the potential for a solution, this prong assesses whether there is a problem. Voting must be racially polarized–that is, the minority and majority groups must regularly, though not always, support different candidates.

Moreover, racial-bloc voting must be sufficiently great to defeat the minority’s preferred candidate. After all, if a black candidate in a 40% black district receives 85% of the black vote and 35% of the white vote, the black candidate will still win with 55%.

If the minority candidate can win without drawing a district with a majority of group members, the Court did not really see a problem. Why should courts intervene to aid minority candidates if they have a good shot even without their help?

So the racial-bloc voting has to be sufficient to defeat the minority’s preferred candidate. For example, in the same district, if the black candidates rarely received more than 10% of the white vote, they would usually lose and meet the requirement.

In cases in which minorities can win with reasonable frequency even if they do not constitute a majority, courts are more reluctant to create districts. Del. Ana Sol Gutiérrez has argued for creating a subdistrict in District 18 to elect a Latino candidate. But her repeated election from a district without a Latino majority would provide evidence for the other side in a court case.

Note that I refer to the minority’s preferred candidate. The point is the candidate preferred by the minority group regardless of the race of the candidate. So white candidates who receive a majority of the black vote running against a black candidate are still minority-preferred candidates–or candidates of choice in the argot. Still, results from elections with candidates of the same race as the group at issue are considered especially valuable in assessing racial polarization in voting rights cases.

One also has to be careful not to lump minority groups together willy-nilly. Courts do not just combine African Americans, Latinos, and Asian Americans into a single category. On the contrary, one would need to prove that such groups consistently vote together to  begin to make such a case. And they often don’t.

If you’d like to know more, you can buy a copy of my book, The Paradox of Representation: Racial Gerrymandering and Minority Interests in Congress, (the perfect Easter or Passover gift) or look online at Google Scholar or Research Gate for my articles in various political science and law journals.


Share

Competition and Responsiveness in Redistricting

In previous posts, I’ve contended that Maryland’s extremely non-compact districts are nonetheless less skewed to the Democrats than many think. Moreover, compactness and non-partisan maps don’t necessarily result in fair outcomes.

Today, I look at the role of redistricting in promoting competition and responsiveness. The argument in favor rests on the idea that competition is the lifeblood of democracy. It helps voters keep politicians accountable. When voters swing away from one party and to another, the results should reflect the change.

It may seem odd to take into account whether a plan creates competitive districts. However, the Arizona Independent Redistricting Commission operates under a mandate to prioritize them. It would also potentially result in greater shifts in House seats with changes in the vote for the U.S. House.

Not all agree that competition and responsiveness are a good thing. Tom Brunell has provocatively argued that mapmakers should create as many ultra-safe districts as possible. He points out that fewer voters cast ballots for the losing candidate–and therefore are happier with the outcome–in safe districts.

Let’s work with the other side of the argument, as I suspect more prefer responsiveness to changes in voting behavior rather than static outcomes no matter the election results. How well does Maryland’s current plan promote competition (i.e. close elections) or responsiveness (i.e. changes in seats won with changes in voting behavior)?

Not well. In 2012. the closest race was in the Sixth where challenge John Delaney ousted incumbent Rep. Roscoe Bartlett by 21 points. The next closest race was in the Eighth where Rep. Chris Van Hollen won reelection from his redrawn district by over 30 points.

If Republicans have a problem with the map, it should not be that it is inherently unfair. After all, if Maryland Republican candidates could win one-half of the votes, they likely carry one-half of the seats. Nevertheless, the plan doesn’t look likely to respond to less major changes in the electorate.

Below is a rough draft of a plan that reflects the Democratic edge but is likely to be more responsive to changes in electoral outcomes:

LublinPlan1More Competitive Congressional Redistricting Plan

President Obama won a majority in 2008 in seven of the eight districts. However, his victory level was not nearly as high in several of the districts as under the current plan:

MDCompIn this plan, the Republicans would need a shift of only 1.9% to gain the Third District and 3.0% to gain the Sixth District. One can imagine regular heated competition for both districts with them changing hands depending on the vicissitudes of the electorate.

This plan would also be far more compact and violate fewer county boundaries than the current plan. The 1st would contain the entire Eastern Shore along with Harford and a bit of northern Baltimore County. It does not cross the Bay Bridge. The Seventh, a 54% black voting-age population district, would include all of Baltimore City along with a chunk of neighboring Baltimore County.

The new 2nd would take in the remainder of Baltimore County along with a bit of neighboring Carroll. The 8th is entirely in Montgomery County. The 6th includes all of western Maryland along with almost all of the rest of Montgomery. The 4th, a 61% black VAP district, is almost entirely in northern Prince George’s.

Finally, the 5th is composed of southern Maryland, the rest of Prince George’s and southern Anne Arundel. The 3rd becomes a central Maryland district with all of Howard, northern Anne Arundel and most of Carrol Counties.

The major problem with this plan is that is most likely too favorable to the Republicans. A gain of 7.8% of the vote would allow the GOP to win one-half of the districts even though they would fall far short of the vote share required for an even statewide split.

They might even win all four with an even smaller percentage as the new versions of the 2nd, 3rd, and 6th contain above average shares of white voters. This matters because whites are more likely to shift way from the Democrats when a pro-Republican wind blows than black voters, who are highly concentrated in the 4th and 7th.

So greater competition and responsiveness not always conducive to partisan fairness. However, one might be able to construct a plan that better meets both requirements, though that could result in less compact districts.


Share

Rorschach Map of Incumbent Desires

Much has been made of the, ahem, “creative” boundaries of Maryland’s current congressional districts. A previous post provided more detailed maps that show the true artistry of the districts. But here is a statewide view that probably doesn’t do it full justice:

CDMDMaryland’s Current Congressional District Map

Many cite the non-compact boundaries as evidence of partisanship. Certainly, the 6th District was reconfigured to aid Democrats, who picked up the seat in 2012. However, Democrats did not have to draw these non-compact districts to gain a 7-1 majority in place of the previous 6-2 split. The following plan has seven districts that Obama won by 15% or more in 2008:

Obama15ptsAlternative Congressional Plan 1

While probably not the most compact plan that could be drawn, it also is clearly much more compact than the enacted plan. Beyond containing seven very Democratic districts, it also still contains two districts that are over 50% black in voting-age population.

A map that gave Democrats at least a 10% advantage in seven districts, again as measured by support for Obama in 2008, could be made even more compact and violate fewer county boundaries:

Obama10ptsAlternative Congressional District Plan 2

In this version, District 8 doesn’t reach the Pennsylvania border or take in any portion of Carroll County, which is no longer split. The Fourth District is also entirely within Prince George’s. Montgomery County has only two districts instead of three.

So why did the Democrats choose to adopt a plan with such meandering districts instead of a simpler version? According to many different sources, the answer lies in the desire to favor the preferences of certain incumbents, even when they were highly idiosyncratic and would not alter their reelection chances.

(1) Rep. Steny Hoyer insisted on continuing to represent UMD College Park, which he has represented since entering Congress. (Love the Turtle!) However, College Park is at the northwestern end of Prince George’s. Accommodating the desires of this powerful representative forced many other changes to plan.

For example, the 4th couldn’t continue to go into Montgomery if the 6th was to take in significant portions of that County, so the 4th now crawls around the edge of Prince George’s to enable it to scoop up Republican voters in Anne Arundel.

(2) Similarly, Rep. Dutch Ruppersberger sits on the intelligence committee and wanted to represent both Fort Meade and the Aberdeen Proving Ground. (Couldn’t we just buy him his own spy cam?) Even more creativity ensued as these two facilities lies at the opposite ends of the Baltimore region

(3) Rep. Elijah Cummings did not want to represent Carroll County, throwing yet another complication into the mix. Carroll is very Republican but would have easily been swamped by Cummings’ Baltimore base. So now Rep. Chris Van Hollen represents parts of Carroll County.

(4) Rep. John Sarbanes felt strongly that he wanted to continue to represent Annapolis, adding another layer of complexity into the plan’s requirements. Drafting a plan to satisfied this demand along with Ruppersberger’s helps explain how the 2nd and 3rd districts took on even more convoluted shapes.

(5) Complicating it all further was that so several representatives–Cummings, Harris, Ruppersberger, and Sarbanes–live with a small area near Baltimore. While living in the district is not required–just ask John Delaney–most prefer to do it.

And that’s how we ended up with this:

CD3

By the way, there is no legal impediment to gerrymandering for incumbents. Indeed, courts have cited it as a legitimate rationale for states to craft plans in a particular manner.

Share

All the Pretty Districts

In two posts yesterday, I argued that Maryland’s congressional redistricting plan is less outrageously biased to the Democrats than assumed by many despite its extremely non-compact lines. This post focuses on why pretty, compact lines may not produce plans that treat both parties fairly.

First, one can still gerrymander without necessarily producing especially non-compact shapes. In the 1980s, Arizona GOP adopted a plan that did not look particularly bad but still worked greatly to their benefit by packing Democrats into a single district.

The one Democratic district had a reasonably regular triangular shape. But it stretched across hundreds of miles of empty desert with its vertices being Yuma along with the especially Democratic sections of Phoenix and Tucson.

MD1990sCDsMaryland Congressional Plan 1992-2000

The Maryland plan used from 1992 through 2000 may not have been as compact as possible but was much more so than the current plan. Though drafted by Democrats, it didn’t work very well for them in the 2000 elections.

MD2000CDelection2000 Maryland Congressional Results

The Democrats won by more than 200,000 votes, or 11%, but still only won 50% of the eight seats. Usually, though by no means always, a clear win in votes will give the majority party more than its fair share of seats.

As this example demonstrates, the outcome in single-member district electoral systems depends heavily upon how the votes are distributed. Parties lose out when they supporters are not efficiently spread across the state.

Parties whose voters are too packed–that is, over concentrated–into a few districts will win those districts by wide margins but forgo opportunities to gain neighboring districts. On the other hand, parties with supporters spread too thinly risk winning no seats even if they receive many votes. In winner-take-all elections, there is no prize for second place.

The distribution of voters often has a major impact on election outcomes even if constituency boundaries are drawn by excellent nonpartisan procedures. The United Kingdom has nonpartisan boundary commissions draw their maps. Yet they hardly treat the two largest parties equally.

Between 1979 and 1992, the Conservatives won four straight elections with between 42% and 44% of the vote. Their majorities varying greatly in size, ranging from 52% to 61% of parliamentary seats. They performed at their best in 1983 when the second and third place parties nearly tied, leaving the Conservatives ahead in more seats than other years.

Labour won 41% to 43% of the vote in 1997 and 2001 but gained more substantial majorities–62% to 63% of all seats–than the Conservatives did with about the same vote share. In 2005, Labour even gained a majority of 55% of seats with just 35% of the vote, the lowest share in British history. However, the Conservatives gained only a minority in 2010 with 36% of the vote.

The key lesson is that maps with compact districts and regular lines do not necessarily produce unbiased outcomes that reward parties with an equal number of seats for the same share of votes. The distribution of voters is critical.

Next up: competitiveness, responsiveness and redistricting.

Share