Category Archives: polarization

Exactly what we don’t need in Annapolis

This statement by conservative Richard Viguerie sums up perfectly the approach that we should endeavor not to import into our newly divided government in Annapolis:

“There’s a certain willingness among conservatives to reconsider our Cuba policy, but the fact that it’s been negotiated by Obama — whom we have no confidence or trust in — makes it suspect,” said Richard Viguerie, a longtime conservative leader. “If this had been done by a trustworthy, conservative Republican, it would have been different.”

Share

Republican Senate Conservatism Varies–But Not Too Much

GOP SenToday, 7S looks at Republicans using the data provided by Boris Shor and Nolan McCarty of state legislator ideology. Remember that a more positive score indicates a more conservative senator, so the bottom of the table are the most conservative. Put another way, the closer to zero, the more moderate the senator. These scores are for the legislator’s entire career in the General Assembly and include House as well as Senate service.

Republican scores range from 0.330 for Sen. George Edwards (R-Garrett, Allegany and Washington) and 1.200 for Senator-Elect Gail Bates (R-Howard). (Three incoming Republican senators do not have scores because they have never served in the General Assembly.) In contrast, the most progressive Democrat, Sen. Rich Madaleno (D-Montgomery), has a score of -1.864 and the most moderate Democrat, Sen. Jim Brochin (D-Baltimore County) receives a rating of -0.285.

Two of the three most moderate Republicans represent Western Maryland–Edwards and Sen. Christopher Shank (R-Washington). However, the two Eastern Shore Republicans are not close ideologically with Senator-Elect Addie Eckardt (R-Mid Shore) more moderate than Sen. Steve Hershey (R-Upper Shore).

Similarly, the two Anne Arundel senators are not an ideological matched set. Sen. Ed Reilly (R-Anne Arundel) is the second most conservative senator while Sen. Bryan Simonaire (Anne Arundel) is more moderate, though the ideological distance is smaller than for the two Shore Republicans.

Perhaps most critical is that all Republicans are notably more conservative than all Democrats. The distance between the most moderate Democrat and Republican (0.615) is greater than that between the most conservative Republican, Senator-Elect Bates, and the second most “moderate” Republican, Senator-Elect Eckardt. And even the most moderate Republcian, Sen. Edwards, is closer to all but three Republicans than the most moderate Democrat.

Share

Ten Most Conservative Democratic Senators

ConsSen

While yesterday’s post focused on the most progressive members of the Democratic Senate Caucus, today 7S looks at the most conservative Democrats using the same data provided by Boris Shor and Nolan McCarty of state legislator ideology. Remember that a more negative score indicates a more progressive senator, so the bottom of the table indicates the most conservative senators. These scores are for the legislator’s entire career in the General Assembly and include House as well as Senate service.

Interestingly, only one of the most moderate Democrats hails from Baltimore City, Montgomery, or Prince George’s County. Prince George’s Sen. Anthony Muse, who backed Larry Hogan in the Governor’s race following a quixotic primary challenge to U.S. Sen. Ben Cardin, is the seventh most conservative Democrat.

Baltimore County Sen. Jim Brochin is the most moderate Democrat, followed by Sen. Kathy Klausmeier, who also hails from Baltimore County. Sen. Bobby Zirkin, the eighth most moderate senator, is the final Baltimore County senator on the list. The other members of Baltimore County’s Senate delegation will be either African-American Democrats or Republicans. Sen. Jim DeGrange and Sen. John Astle, the fourth and fifth most conservative Democrats, represent Anne Arundel.

The final members of the list come from different counties. Sen. Jim Mathias, the third most moderate Democrat, represents the lower Eastern Shore. Sen. Mac Middleton is from increasingly Democratic Charles. Sen. Ron Young represents Frederick, a county that has become more Democratic than in the past in recent elections but went strongly for Larry Hogan.

Finally, Sen. Ed Kasemeyer, the most liberal member of this group of moderates is from Howard, a county that is now solidly Democratic in federal contests but that elected a moderate Republican, Alan Kittleman, as County Executive, and also voted for Larry Hogan.

Share

New Senate Set for Greater Polarization

MD Senate Id Change

Past posts have mentioned that the new Maryland General Assembly will be more polarized than the previous one. But what is the measurable impact of the election? Fortunately, since many new senators were formerly delegates, there are measures of their ideology in relation to other legislators.

Using the same dataset provided by Boris Shor and Nolan McCarty of state legislator ideology mentioned in previous posts, this post examines directly the ideology of incoming senators as compared to the people they are replacing. (The scale ranges from around -1.9 for the most liberal Democrat to 1.2 for the most conservative Republican with moderates closest to zero.)

In two cases, measures are not available but the impact is clear. Sens. Roy Dyson and Norm Stone were among the most very moderate members of the Democratic Caucus. They are being replaced by conservative Republicans. These changes will leave the Democrats more liberal and quite possibly also make the Republicans more conservative.

Two cases of Republicans being replaced by fellow Republicans will clearly make the GOP Caucus more conservative. Del. Gail Bates is more conservative than Alan Kittleman. Similarly, Del. Wayne Norman is also more conservative than Sen. Barry Glassman.

There are seven cases with less dramatic changes. Despite the fierce primary, Del. Michael Hough’s voting record has not been dramatically more conservative than Sen. Michael Brinkley. Theirs may be a difference more of style than of substance. But a more confrontational style likely exacerbates polarization.

In Howard County, Del. Guy Guzzone is a bit more liberal than outgoing Sen. Jim Robey. Del. Susan Lee is just a tad more liberal than AG-Elect Brian Frosh. Retiring Sen. Verna Jones-Rodwell has a somewhat less liberal voting record than Del. Shirley Nathan-Pulliam. The impact of the replacement of conservative Sen. Nancy Jacobs by Bob Casilly is less clear but it would be surprising if he turns out to be less conservative than Jacobs.

In two cases, changes may mildly reduce polarization. During her previous service in the House, Cheryl Kagan was a bit less liberal than outgoing Sen. Jennie Forehand. Similarly, Del. Addie Eckardt is a tad less conservative than defeated Sen. Richard Colburn. She is also viewed as a more thoughtful and productive member of the General Assembly than Colburn, who focused on scoring political points rather than shaping legislation.

The Overall Impact

Excluding the three seats won by people who have not served previously in the General Assembly, here are the calculations for the overall ideology of the Senate.

Median D: -1.107 (change of -0.005).
Mean D: -1.115 (change of -0.047).

Median R: 0.881 (change of 0.124).
Mean R: 0.883 (change of 0.062).

Increase in Polarization (Medians): 0.13 (7% increase).
Increase in Polarization (Means): 0.11 (6% increase).

Remember that these calculations underestimate increases in polarization because they exclude the two cases that will have the most dramatic impact–the replacement of Dyson and Stone–especially on the Democratic side as they were among the five most moderate Democrats in the Senate.

Share

Regional Political Chasm Expands

maryland-county-map

America in Miniature has very distinct political regions. I’ve divided Maryland into seven here. Republicans eliminated many of the remaining Democratic officeholders in 2014 in three rock-ribbed Republican regions–Western Maryland, Eastern Shore, and Outer Baltimore Bastions. Democrats retain iron grips on the Washington Suburbs and Baltimore City. These areas have very completely different interests and perspective on key issues facing the State.

Among the two remaining regions, Southern Maryland is really divided into two areas moving strongly in opposite directions, which just reinforces the divisions between the other regions. However, the four counties in the Swingy Outer Suburbs constitute the more marginal political territory in Maryland elections. Often up for grabs, Republicans advanced in 2014 through impressive gains in this important region.

Western Maryland

District 1 and 2 are located entirely within Garrett, Allegany, and Washington counties, and both will send entirely Republican delegations to the General Assembly. Their county commissions are also all one-party affairs. Hogan won between 75% and 80% of the vote in these three counties.

Eastern Shore

The Eastern Shore contains nine counties: Cecil, Kent, Queen Anne’s Dorchester, Caroline, Talbot, Somerset, Wicomico, and Worcester. Districts 35A, 36, 37, and 38 are located on the shore (the rest of D35 includes northern Cecil and will be discussed with Harford.) Unsurprisingly, Hogan did well here, taking between 65% and 80% of the vote in the nine Eastern Shore counties.

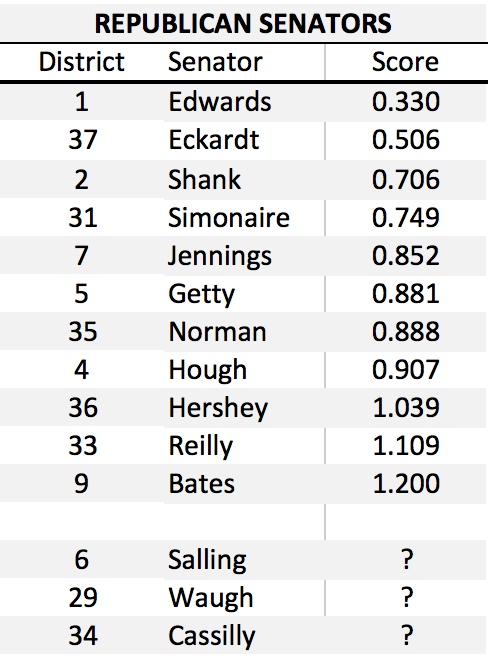
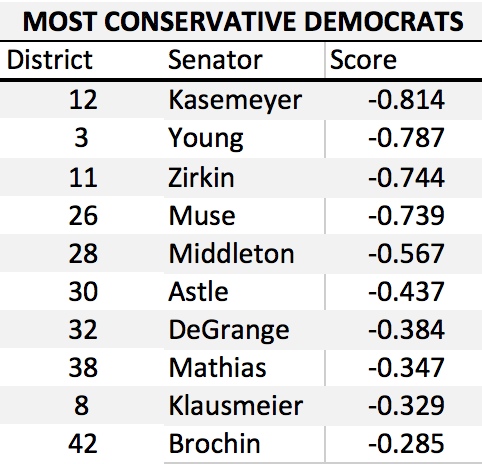
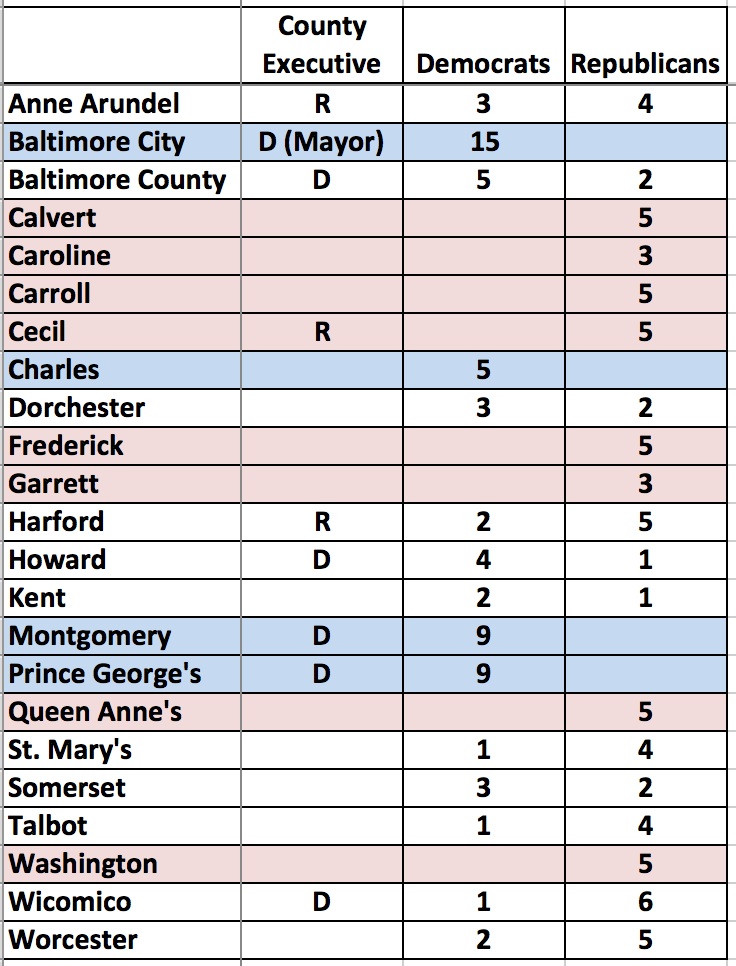
(Corrections made to this paragraph.) The Shore’s General Assembly delegation is heavily Republican. Majority-black District 37A’s sole delegate is the only Democratic delegate as compared to nine Republicans. Thanks to the political talent of Sen. Jim Mathias, the Democrats also hold one of the Shore’s three Senate seats. Republicans also dominate country government with 34 commission or council seats to just 11 for the Democrats.

Republicans hold all seats on the commissions or councils of Cecil, Queen Anne’s, Caroline, and Talbot Counties. They also form majorities in Wicomico and Worcester Counties. Democrats hang on to majority status by a single seat in Dorchester, Kent, and Somerset Counties–three of the Shore’s smaller counties.

Baltimore City

All six senators and sixteen delegates from the City are Republicans Democrats (Districts 40, 41, 43, 45, and 46 in their entirety as well as District 44A). The Democrats sweep city elections with similar regularity. Hogan won 22% of the vote in the City–not too bad really for a statewide Republican candidate.

Washington Suburbs

Montgomery and Prince George’s Counties are the two other large Democratic bastions. Together they contribute 16 senators and 47 delegates to the Democratic majorities in the General Assembly (Districts 14-27, 39, 47 but 27C is completely outside of Prince George’s). Democrats also easily mop up the seats on both county councils. Hogan received 37% of the vote in Montgomery but only 15% in Prince George’s.

Southern Maryland

The three counties of southern Maryland have been trending in two different directions. While growth, particularly that related to the Navy, has tilted Calvert and St. Mary’s increasingly Republican, growing African-American suburbanization has pushed Charles in the other direction.

Democrats now control the senator and three delegates from Charles (District 28) and hold all county offices. On the other hand, Republicans hold the one senator and four delegates elected entirely from St. Mary’s and Calvert (District 29 and District 27C), as well as completely dominate county offices. Hogan won 69% in Calvert and 73% in St. Mary’s. Though Hogan lost Charles, he showed surprising strength at 47% in a county that has gone for the Democrats by steadily increasing margins.

Swingy Outer Suburbs

Anne Arundel, Baltimore County, Frederick and Howard are  key pivots in state elections. All went for Hogan–52% in Howard, 59% in Baltimore County, 64% in Frederick, and 66% in Anne Arundel. All have mixed representation on their county councils with Howard heavily Democratic, Baltimore leaning Democratic, Anne Arundel leaning Republican, and Frederick heavily Republican. Republicans hold county executive seats in Anne Arundel and Howard while Democrats claim Baltimore County and Frederick.

Many of the more competitive elections for the General Assembly occur in these four counties, though there are also several solid legislative districts for each party. (Districts 3-4 in Frederick, Districts 6, 8, 10, 11, 42 and 44B in Baltimore, Districts 9, 12, 13 in Howard, District 30-33 in Anne Arundel.)

While Democrats lead 10-5 in Senate seats, they hold a smaller margin of 15-13 in House seats for these counties. Republicans picked up a several seats that Democrats had hoped to take in this region in 2014. Republicans have to continue to do well in these areas if they hope to make inroads in Maryland. All four counties have been moving towards the Democrats in presidential contests.

Outer Baltimore Bastions

Carroll and Harford Counties are Republican dream lands. Hogan was 82% in Carroll and 77% in Harford. Republicans control all county council seats in both places, as well as the executive in Harford.

Republicans now control all but one General Assembly seat, sending four senators and ten delegates to augment the GOP Caucuses. One Democratic delegate hangs on in District 34A. (District 5 is entirely within Carroll and 34 within Harford. District 7 straddles the Baltimore-Harford line but resembles Harford politically. District 35B is split between Cecil and Harford with 35A in Cecil.)

Share

Polarization Up in the Maryland General Assembly

Political scientists Boris Shor and Nolan McCarty have developed measures of state legislator ideology similar to the NOMINATE scores presented in yesterday’s post on congressional polarization. The Shor and McCarty scores are considered the best measures of state legislator ideology by political scientists and were developed through spatial modeling techniques that allow comparability both across states and years.

For individual legislators, more positive scores indicate greater conservatism while more negative scores indicate greater liberalism. The scores only range so low and high. A very rough indicator suggests that legislators with scores above 1 are especially conservative and legislators with scores below -1 are particularly liberal. Moderate legislators receive scores closer to zero.

In both the House of Delegates and the Senate, differences between the median Republican and median Democrats in each chamber have widened over time , as the figure below shows. (If there were no difference in the ideology of each member, the difference measure would equal zero.)

MedianPartyDiff

Since 1996, partisan differences in the House of Delegates have increased from 1.71 to 1.96–a gain of 15%. The Senate started with lower polarization but has now almost caught up as differences rose from 1.22 to 1.84–a gain of 51%.

The rise in polarization is not due entirely to changes in the ideology of just Republicans or just Democrats. Republicans have become more conservative while Democrats have moved to the left. The median House Democrat is now 13% more liberal than in 1996 and the median House Republican is 17% more conservative.

HoDMedians

The same process has occurred in the Senate, though Republicans have lurched more to the right than Democrats have to the left. The biggest change occurred after the 1998 elections when several moderate Republicans were replaced by more conservative members of their party.

SenateMedians

Since 1996, Democratic liberalism has risen by 16%–a comparable change to that in the House–but Republican conservatism has shot up by 264%. This change is less drastic than it sounds. Senate Republicans in 2013 were still a tad less conservative than their counterparts in the House.

The party caucuses have not just become more ideologically different. They have also become more cohesive. The following figure shows the standard deviation in the Shor-McCarty scores for each year and party in both houses:

PartyCohesion

The decline in the standard deviation means that there is less variation around the average score for each party. In other words, Republicans are not just more conservative, they are also more cohesively conservative. The same is true for Democrats. But Democrats were much less cohesive than Republicans in 2013, reflecting that more moderate Democrats had survived than moderate Republicans.

Next up: the likely impact of the 2014 elections.

Share

Why Polarization?

In the U.S., Democratic elected officials have become steadily more liberal while Republican elected officials have marched even faster in the conservative direction. As a result, polarization in the Senate and House of Representatives has increased:

PolarCong

The graphs show the difference in ideology between the average Democrat and average Republican over time–zero suggests no average difference in ideology according to the NOMINATE scores, which are widely used in political science. (UCSD Prof. Gary Jacobson, one of the country’s very top experts on Congress, kindly shared versions of these graphs with me.)

The increased polarization has resulted in the decimation of moderates in the House. Here is the distribution of representatives by party and ideology in the 93rd Congress:

Jacob93

According to the measure used here, right on the horizontal axis (i.e. more positive numbers) equates to greater conservatism while left on the same axis equates to liberalism (i.e. more negative numbers). Representatives with scores close to zero are relatively moderate.

In 1973-4, while Democrats tended to be more liberal than Republicans, there was still a lot of overlap between members of the two parties. A fair number of Republicans are more liberal than some Democrats. Similarly, many Democrats are more conservative than their Republican colleagues.

Now, look at the distribution for the House in 2011-12:

Jacob112

Not only is there no overlap between the two parties, there is even distance between the most liberal Republican and the most conservative Democrat. No wonder it is so hard to form bipartisan coalitions that can produce legislation in our divided government.

The new Congress will be even more polarized. The Democrats who lost tended to be among the most conservative members, such as Rep. Barrow from Georgia. Newly elected Republicans also tend to be more conservative than the colleagues that they replace.

Overall, both parties have become more extreme. The data indicates, however, that Republicans have moved twice as fast to the right as Democrats have to the left. But just because the Democrats have moved more slowly, does not mean that they will not eventually arrive.

Why is this happening?

Many explanations are mooted to explain it but two factors have clearly played a major role: (1) the people who identify with each party are more ideologically homogenous, and (2) the people who vote in party primaries, and choose nominees, are more extreme than all members of their own party.

The following figure by Pew shows the composition of the primary electorates of both parties in 2010 and 2014. Among Democrats, 64% of primary voters were liberal in 2014 and 76% in 2010. Among Republicans, 69% of primary voters were conservative in 2014 and 77% in 2010.

The decline in extremism from 2010 to 2014 is illusory as the survey methods were different. Unlike in 2010, the 2014 survey utilizes self-reported voters but many survey respondents say they voted even though they did not and the non-voters are more likely to be moderates. Regardless, the primary electorates of both parties are more extreme than in past decades.

Primaries

Most representatives are from districts that are generally safe for one party or the other, so they naturally focus on the party primary–heavily skewed in one ideological direction.

But even fewer safe districts wouldn’t really undercut polarization. The ideological distribution of primary voters is such that nominees must cater to them even if winning the general election requires moderation. Marylanders should remember when liberal Del. James Hattery beat more moderate Rep. Beverly Byron in the 1992 primary. Hattery then promptly lost the seat to Roscoe Bartlett.

The same dynamics are occurring in Maryland legislative elections. The new Democratic caucuses in the General Assembly will contain more liberal and fewer moderate members than in past years. The retirees and the defeated are disproportionately among the more conservative Democrats (e.g. Dyson and James). Similarly, the Republican caucuses will also be more staunchly conservative. Republican retirees (e.g. Kittleman and Brinkley) were more moderate and willing to work with Democrats than their replacements.

Governor-Elect Hogan is going to have a difficult time navigating these political waters. In order for legislation to pass the General Assembly, it will require substantial Democratic support. However, the required compromises risk alienating conservative legislators who are opposed to arriving at accommodations with the Assembly’s liberal majorities even though it is vital to the operation of Maryland government.

The next four years will be many things but boring isn’t one of them.

Share

Monopoly County Politics

terpopolyFear this Turtle?

As the last post detailed, a majority of Maryland counties have legislatures with representatives from only one party. Democrats in my home county of Montgomery enjoy their hyperdominant status, and celebrated heartily the electoral demise of the County’s last Republican officials in the 1990s.

One-party monopolies create a number of problems. In this case, I am not referring to unified party control of the legislature and executive, as in the case of the Maryland State Government with Democrats holding both houses of the General Assembly as well as the Governor’s Mansion. Instead, in this context, single-party control references when one party controls government so thoroughly that there is no meaningful opposition.

Political scientists have long observed that problems can arise for democratic governance when one party controls politics so thoroughly that there is no real electoral competition in the general election. (V. O. Key was a pioneer in this area and his classic work on Southern Politics inspired many of my thoughts here.)

First, the party primaries of one party become the key election in place of the general election. Only a small fraction of voters choose the party’s nominee (read: elect the official). In Maryland, turnout is already lower in gubernatorial than presidental election years and turnout is far lower in primaries than in general elections. Moreover, despite one-party dominance, many still remain registered as independents or with another party, further shrinking the share participating in the one meaningful contest.

Think the case is overstated? In Montgomery County, 83,827 voted in the 2010 Democratic primary–just 14.7% of the County’s 569,234 eligible voters. Prince George’s did a little better because the County has fewer non-Democrats with 96,652 casting ballots in the Democratic primary out of 498,718 eligible voters–19.4%.

This same effect also occurs in Republican counties, though the impact is somewhat less drastic. In Carroll County, 19,845 voted in the 2010 Republican primary, 22.8% of all eligible voters. In Garrett County, 5,398 cast ballots in the GOP primary, forming 33.2% of the 16,256 eligible.

Second, it leads to disorganized politics and makes it difficult to hold government accountable. For the all the derision directed at parties and partisanship, political parties serve extremely valuable purposes. The collage of views that animate each party organize politics for voters. In elections, the party label is a recognizable brand, which provides a quick cue to voters looking to cast a ballot. We rely on similar shortcuts in many aspects of life.

Places without a viable opposition party lack these cues and organization because all the action takes place in the primary. Parsing differences between candidates is difficult without party labels. Voters have to work much harder.

The absence of party divisions also makes it more difficult to vote based on the basis of overall satisfaction with the government. When one party is so strongly dominant, it is more difficult to throw out the “ins” and replace them with the “outs” because  there is no viable opposition and the “ins” and the “outs” belong to one party.

Additionally, in single-party places, one party tends to accommodate a  larger range of views as people gravitate to the party of power. Occasionally, clear factions will appear within parties, as with Doug Duncan’s 2002 “End Gridlock” slate. But such linkages tend to be ephemeral and the labels don’t appear on the ballot. It can also make it easier for individual politicians to shift positions over time since there are a panoply of views within one party.

All of this helps explain why the Montgomery County Council is perpetually so factionalized with shifting alliances that are often based on personality conflicts and not issues. There are genuine issue differences in Montgomery but there is no party alignment to help organize them and make it easier for voters to hold officials accountable for their decisions.

The next post on county politics will begin to explore the causes of one-party counties and ideas about what we can do about it to produce better governance.


Share

Partisan Breakdown of County Governments

CountyCouncils

Pre-2014 Election County Executives and Councils

Maryland has fewer subdivisions than almost any other state with just 23 counties and one independent city. Except Baltimore City, all elect their legislatures–Councils or Commission–at the same time as the gubernatorial election. Starting in 2016, Baltimore’s City will be in sync with the presidential election cycle.

Besides legislatures, eight counties with home rule charters directly elect a county executive, functionally equivalent to that of mayor–the title given to Baltimore City’s executive. Frederick County’s voters approved its charter in 2012 and will elect its first county executive this year.

The above table shows the pre-2014 election partisan breakdown of county executives and legislatures for all counties and Baltimore City, highlighting one party counties based on the party of the legislature with red indicating Republican and blue Democratic counties .

Nine have only Republican legislatures (and executives): Allegany, Calvert, Caroline, Carroll, Cecil, Frederick, Garrett, Queen Anne’s, and Washington. Four are solidly Democratic: Baltimore City, Charles, Montgomery, and Prince George’s.

Most Republican counties are small, though Calvert, Carroll, Frederick, and Queen Anne’s are fast-growing exurbs. Calvert, Carroll and Queen Anne’s are all solidly Republican, though more overwhelmingly in Carroll than Calvert or Queen Anne’s. Frederick leans Republican but has been moving towards the Democrats. Whether the trend will continue strongly enough to push the County away from the GOP remains to be seen.

Three counties and Baltimore City sit in the Democratic camp. All are overwhelmingly Democratic with Republicans having next to no chance.  In Prince George’s, only one Republican has so far filed for a Council seat. Democrats would still hold a bare majority on the Montgomery Council even if every Republican candidate won. Republicans have filed for only two seats on the Charles Commission.

The remaining eleven counties have split councils or commissions, though many lean heavily to either the Democrats or the Republicans. Harford, St. Mary’s, Talbot, Wicomico, and Worcester list towards the Republicans, while Baltimore County and Howard favor the Democrats. Anne Arundel leans GOP but seems increasingly marginal for a place expected once to be a Republican bastion.

Due to the plentiful rural Republican counties, there are 75 Republican legislators compared to 65 Democrats in very blue Maryland. Must make politics for officer elections at the Maryland Association of Counties (MACO) interesting.


Share

How Polarized is the General Assembly?

The Monkey Cage has a great post that compares legislative polarization all 50 states. The first graph (credit to Boris Shor) shows polarization averaged across both chambers from 1996 through 2013. As you can see, Maryland is the fourteenth most polarized state in the country, though not that terribly far above American average.

statepolar

Polarization is greatest in California where Democrats are very liberal and Republicans are very conservative, as shown in Shor’s second graph. In this graph, the vertical axis measures conservatism and the horizontal axis shows the year. The graph not only makes it possible to compare the parties within states but across states.

polar by chamber

The change in polarization within each chamber over time is more easily assessed with yet another graph produced by Boris Shor and Nolan McCarty that charts polarization over time for both chambers in 49 states and Nebraska’s unique unicameral legislature.

polarization_chamber_years2

In Maryland, polarization in the House has been relatively flat over the last two decades. Polarization has increased in the Maryland Senate. A bump up around the time of the 1998 elections increased Senate levels to those of the House. The Senate is now slightly more polarized than the House after another smaller increase in Senate polarization after the 2002 elections.

In Congress, heightened polarization has been driven much more by Republicans than Democrats, though Democrats are more liberal than in the past. The changes in General Assembly polarization appear driven more or less equally by both parties. Over the 18 years in the study, Democratic liberalism and Republican conservatism each increased by roughly 0.25 on the scale. (A very close look indicates that Republican conservatism probably increased slightly more than Democratic liberalism.)

These trends are not terribly shocking to followers of Maryland politics. More moderate Republicans like former Del. Connie Morella and Sens. Jean Roesser and Howard Denis no longer sit in the General Assembly, as many moderate Republicans have become Democrats and Montgomery County Democrats are no longer willing to vote for even moderate Republicans in sufficient numbers. Republicans have also seen several mainstream conservative senators defeated by more conservative delegates in primaries.

Conservative Democratic numbers have dwindled. Places that elected conservative Democrats now usually choose Republicans. Though a few, like Del. David Randolph, hang on in territory that is tough for Democrats, the days of the Eastern Shore electing very conservative Democrats like Sen. Frederick Malkus are over.

Share