Category Archives: Fourth Congressional District

Federal Employees in CD4 and CD8

Today, I am pleased to present a guest post from Adam Pagnucco:

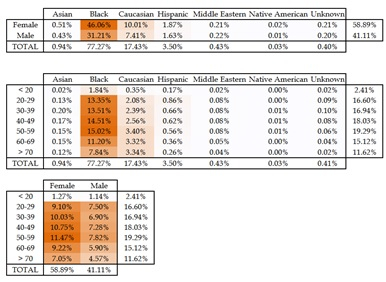
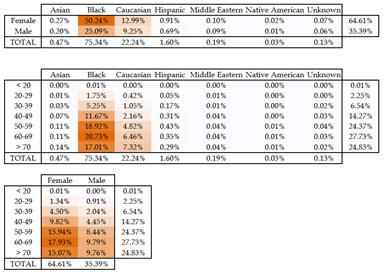
Candidates in both Congressional Districts 4 and 8 are targeting predictable Democratic Party constituencies like women, liberals, environmentalists, African Americans and Latinos for votes. That’s standard operating procedure in most Democratic primaries. But because of the geographic peculiarity of the two districts, there’s another constituency that could play a major role in deciding the election: federal employees.

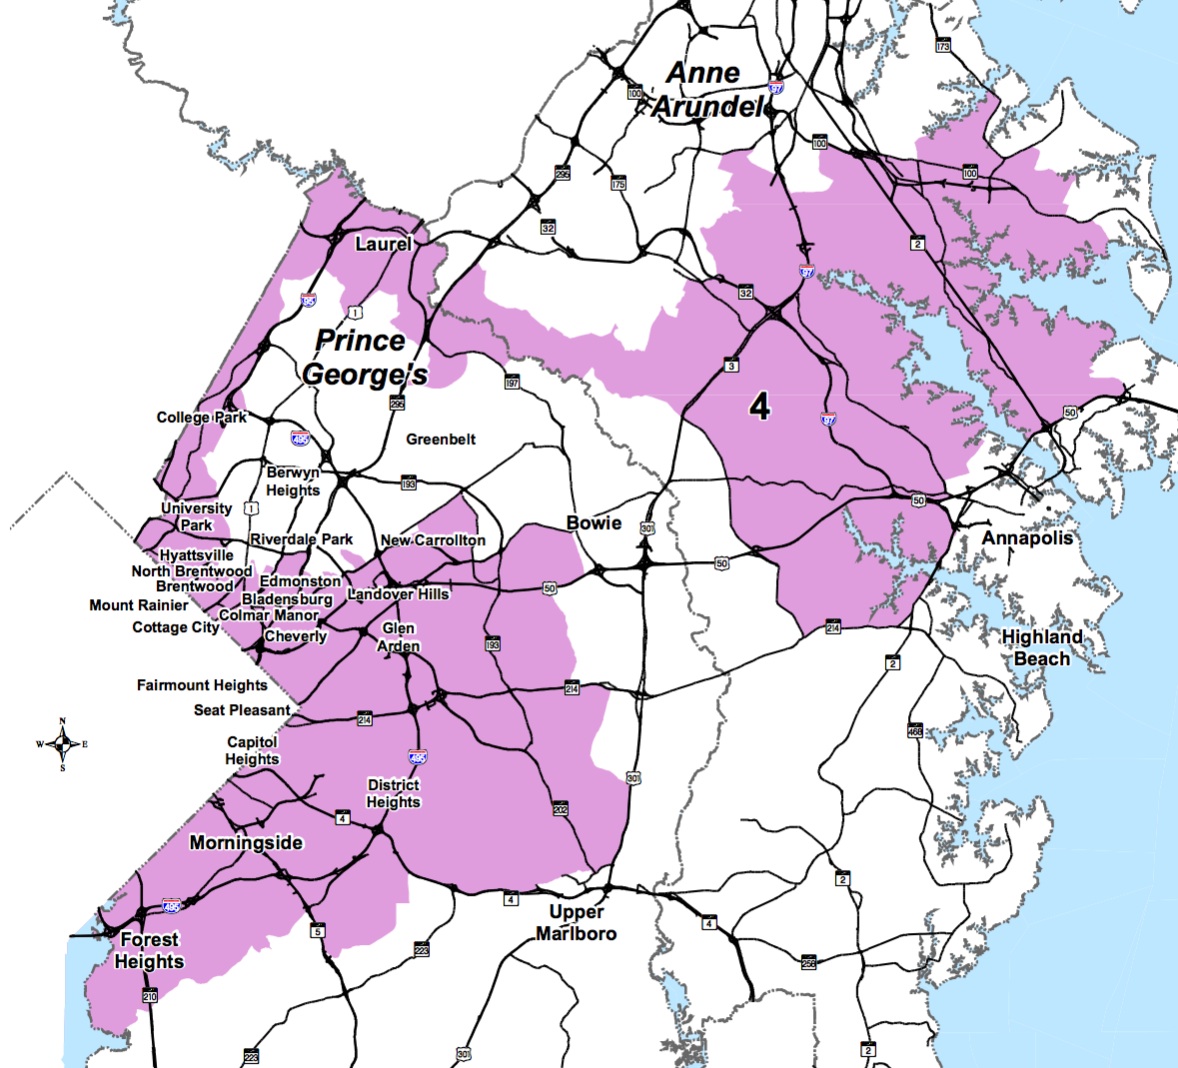
Because Montgomery and Prince George’s Counties border the District of Columbia, they have countless thousands of residents who commute to federal jobs downtown every day. The two counties also have numerous large federal employers of their own, including the National Institutes of Health, Andrews Air Force Base, the Census Bureau, NASA, the Food and Drug Administration, the Department of Health and Human Services, Walter Reed, NOAA and more. Prince George’s is making a strong bid to host the FBI. Anne Arundel County, which has part of CD4, is home to Fort Meade and the Naval Academy.

According to the U.S. Bureau of Labor Statistics and the U.S. Bureau of Economic Analysis, federal employers constitute about ten percent of each county’s employment and personal income.

Federal Employees MoCo PG

But this counts only federal establishments located within each county; it does not count residents who commute outside their boundaries. It also doesn’t count contractors who depend on federal clients or the various industries surrounding the federal government, like lobbying, consulting and legal services. One private sector economic firm estimates that 52% of the Washington area’s total job base is tied in one way or another to the federal government. Regardless of the statistics, it’s reasonable to assume that both CD4 and CD8 have tens of thousands of residents who either work directly for the federal government or who have family or friends who do so. It’s also reasonable to assume that they vote, particularly in Democratic primaries.

One thing that can be said about this group is that they are under stress. Consider recent events pertaining to federal employees.

Salary

While many federal employees are represented by unions, their pay levels are set by federal law and not by collective bargaining. Federal pay was frozen during the 2011-2013 period and rose by 1% in 2014, 1% in 2015 and 1.3% in 2016. Accounting for local area price inflation, federal employee pay fell by 7% in real dollars between 2010 and 2015.

Parental Leave

Federal employees do not have paid parental leave. When they have children, they must either use accumulated sick leave and vacation time or accept unpaid leave. When Sens. Barbara Mikulski and Brian Schatz (D-HI) introduced a bill to provide paid leave last year, Schatz noted, “While private companies are beginning to see the benefits of providing paid family leave, America is still the only industrial nation in the world without a program that gives working parents the time off and income they need to care for a new child.” President Obama provided for paid leave in his latest budget, but congressional Republicans are ignoring it.

Sequester and Shutdown

The rise of a Tea Party Congress led to a spending sequester and a government shutdown in 2013. Shutdowns were barely avoided in September and December of 2015. The sequester has chilled not merely the federal government but the entire regional economy for years.

Budget Uncertainty

Congress’s growing reliance on continuing resolutions and last-minute budgetary showdowns have played havoc with department budgets and make it harder for federal employees to do their jobs. One federal manager commented, “What people don’t realize is that once the budget is approved, it takes time for the money to trickle down to agencies. For example, managers in my agency still don’t have the ability to spend their budgets without getting approval for everything from a contract to a stapler. And we don’t have a firm estimate of when we will be able to spend freely.” Training and travel are often adversely affected.

Retirements and Turnover

Led by Baby Boomers, an exodus of federal employees is underway. Turnover among young workers is also considerable. This puts pressure on those who remain. One federal lawyer commented, “I see that all around me – so many young lawyers that were in my office when I started 5 years ago are gone. Sure, some are leaving because they get fed up with bureaucracy, or want to move onto something else, but being a pawn and/or punching bag of Congress doesn’t help. And the advantages of working in the private or non-profit sector for attorneys can be huge in terms of schedule flexibility (non-profit sector, including universities) or salary/benefits (private sector).”

Republicans in Congress

Make no mistake: Congressional Republicans are targeting federal employees. Last year, the House and Senate each proposed budgets that went after the federal workforce. According to the Sun, “While details of the House and Senate versions of the budget differ, both chambers have approved slashing the size of the federal workforce by 10 percent through attrition, increasing the contribution workers make toward their retirement savings and cutting the share of health insurance covered by the government.” Months later, Senate Republicans floated a plan to fund highway spending by cutting federal pension rates of return. The Chair of the Senate’s committee that oversees the federal workforce opposes the existence of federal unions, wants to trim pension benefits and wants to cut the federal workforce by 10% and contractors by 15%. Another Republican Congressman wants to eliminate dues checkoff for federal unions, a move designed to cripple their finances.

Republican Presidential Candidates

The federal government and its employees are a frequent target of GOP presidential candidates. Carly Fiorina has said, “We have come to a pivotal point in our nation’s history where this nation’s possibilities and potential are being crushed by a government grown so big, so powerful, so inept, so corrupt, and a political class that refuses to do anything about it. . . . the truth is 75 percent of the American people think the government is corrupt.” Rand Paul has said he would like to see “a government so small I can barely see it.” John Kasich wrote that “Washington is obsolete” and wants to gut the Education and Transportation departments. Scott Walker wanted to ban federal unions. But none of them can touch Ted Cruz, who wants to eliminate five departments and 25 smaller agencies that he says “prop up special interests at the taxpayer’s expense.” Cruz’s targets include Commerce, Education, Energy, HUD and the IRS. Cruz would also replace across-the-board pay raises for federal workers with “more opportunities for merit-based pay increases.”

U.S. Senator Barbara Mikulski and Congressman Chris Van Hollen have been strong advocates for federal employees and that has been a component of their immense popularity with their constituents. All candidates in both CD4 and CD8 would be wise to emulate their example. Whoever emerges as the top defender of the federal workforce might get an edge in what could be two close races.

Share

CD4 Target Demographics

Today, 7S looks at the likely demographic composition of the electorate in the Fourth Congressional District. Many thanks to my anonymous reader who has so helpfully shared these statistics with me. The first table shows the share registered Democrats in CD 4 broken down by (1) race and gender, (2) race and age cohort, and (3) gender and age cohort.

CD4 race age genderThe second table presents the same three demographic breakdowns but for voters who participated in two of the last four Democratic primaries. Close examination of the data reveals key differences between the makeup of the potential electorate of registered Democrats and likely voters, defined here as those who have voted in two of the last four primaries.

CD4 race age gender 2 of 4

Race and Ethnicity

First, African Americans will form an overwhelming share of the electorate as they comprise 77.3% of registered Democrats and 75.3% of likely voters.

Latino form 3.5% of registered Democrats but this growing demographic punches below its weight, as Latinos composed just 1.6% of likely voters. However, Latino voter turnout has been steadily increasing, so the turnout over the past four primaries may well underestimate the share of Latinos who will vote in the 2016 Democratic primary.

In contrast, Whites, listed in the table as Caucasians, vote a high rates. They form 17.4% of registered Democrats but 22.2% of likely Democratic primary voters. So far, all of the candidates who are still in the mix for the race are African American. An ability to attract white voters will aid a candidate’s campaign greatly.

Voters would do well to remember that Rep. Al Wynn won this seat originally through his biracial appeal. He came in second in both Prince George’s and Montgomery but defeated a black candidate with support centered in Prince George’s and a white candidate with support primarily in Montgomery.

Similarly, support from whites and Latinos in Montgomery played a critical role in Rep. Donna Edwards’ successful primary challenge to Rep. Al Wynn. In short, candidates who can combine significant black and white support tend to be formidable.

Gender

Women are an impressive 58.9% of registered Democrats but an astounding 64.6% of primary voters. At nearly two-thirds of likely voters, expect candidates to spend a lot of time at events that attract especially high numbers of women.

Candidates will also work hard to identify concerns that can attract a disproportionate share of their votes. No group or gender is monolithic in its voting behavior but some issues resonate with greater effect with women than men.

Race, Gender, and Age

Older voters participate at much higher rates than younger voters in Democratic primaries. Consider than 26.7% of registered Democrats but 52.6% of likely voters are over age 60. If voters wonder why they hear candidates talk a lot more about social security and health care than education, now they know.

African Americans over 60 form 37.7% of the electorate. African Americans over 50 are 56.7% of the electorate. Black women compose the bulk of these voters because (1) women register disproportionately as Democrats, and (2) the gender breakdown of population skews more female among older people.

In the overall population aged 20 to 60, there are roughly 1.03 women for every man among the civilian non-institutionalized population. Those numbers rise dramatically for older people. There are 1.22 women for each man in the over 60 population. That ratio rises to 1.26 for the over 65s and 1.35 for the over 70s.

Older people, especially older women, will play a disproportionate role among white voters too. Likely voters aged 60 and older form 62.0% of white voters. Again, expect these voters to be disproportionately female.

Key Demographics

Likely voters tend to be Black, older, and female. While every individual voter counts and matters, older Black women will be the central force in the Democratic primary for CD 4.

Whites, particularly older White women, can potentially play a pivotal role, as they form over one-fifth of likely voters. Expect all candidates to court this group. Black voters often play a similar role in Democratic primaries in white majority areas.

Share

CD4: Where are the Voters?

CD4

The overwhelmingly Democratic Fourth Congressional District will be open in 2016 since incumbent Rep. Donna Edwards is making a bid for the U.S. Senate rather than seeking reelection. So where do the Democrats who will vote in the primary live?

Registered Democrats by Legislative District

The Fourth CD is split between Anne Arundel and Prince George’s but 86% of registered Democrats live in Prince George’s. Former Prince George’s State’s Attorney Glenn Ivey was on the ballot repeatedly, though he has not been on the ballots since 2006.

The following table shows the number of registered Democrats as well as the number who voted in each of the four past Democratic primaries within the portion of each state legislative district included in the Fourth Congressional District.

cd4 vr1

Newly elected Del. Erek Barron (D-24) is rumored to be interested in running for the Fourth. At 21.0%, D24 has the highest share of registered voters. Though Democratic primary turnout is slightly sub par, voters in this legislative district nonetheless consistently provided over one-fifth of all voters.

District 25 does not lag far behind District 24’s voting power with 18.7% of the CD 4’s registered Democrats. This is Lt. Gov. Anthony Brown’s former legislative district. Talented Del. Dereck Davis (D-25), the powerful Chair of the Economic Matters Committee, is also said to be musing about running for the seat.

Del. Jay Walker (D-26) is openly exploring a bid. Sen. Anthony Muse (D-26) from the same district is also rumored to be thinking about it. D26 has the third highest share of registered Democrats but lags notably behind either D24 or D25 with 14.4% of CD 4’s Democrats. Moreover, turnout is often mediocre–it fell as low as 13.4% of the Fourth’s total though it reached 14.9% on the one occasion in which the share of voters exceeded registrants.

Former Del. Jolene Ivey represented District 47 under different boundaries before redistricting. The current version of D47 holds 13.4% of CD 4’s registered Democrats but turnout consistently lags. In the past four Democratic primaries, voters from D47 never comprised more than 11.9% of the voters in CD 4.

Nevertheless, Jolene Ivey, a successful and highly talented politician in her own right who ran for Lt. Governor last year, will undoubtedly be an asset to her husband Glenn Ivey’s campaign. When she last ran for the House in 2010, she came in first by a mile in a crowded primary with eight candidates.

Del. Joseline Peña-Melnyk (D-21) is planning a run. Currently, she represents just 8.1% of registered Democratic in CD 4. A small base on which to build.

Registered Democrats by Legislative and County Council Districts

The second table shows the share of registered Democrats broken down by state legislative and county council district. None of the Anne Arundel Councilmembers represent more than 5% of registered Democrats in CD 4.

cd4 vr2

Prince George’s Council Vice Chair Derrick Davis (D-6)–not to be confused with the state legislator with the very similar name–represents 20.3% of registered Democrats but 64% also live in Legislative District 25. As this is declared candidate Anthony Brown’s former district and Del. Dereck Davis’s current district, competition for these voters could be fierce.

Councilwoman Karen Toles (D-7) represents 17.4% of CD 4’s registered Democrats. This district has significant overlap with Del. Erek Barron’s legislative district, as well as those of Brown/Davis and Walker/Muse. 15.5% of CD 4’s registered Dems also live in  Council District 5, held by Andrea Harrison. This district has a lot of overlap with D24 (Barron) and D47A (Jolene Ivey).

Former Council Chair Ingrid Turner has expressed interest in running for the Fourth. But she represented Council District 4. In its current incarnation, it falls almost entirely into CD 5. Just 0.8% of CD 4’s registered Dems live in District 4.

Likely Voters by State Legislative and County Council Districts

The final table breaks down the share of Democrats who voted in at least two of the past four primaries by state legislative district and county council district:

cd4 to2

This table indicates even more cleanly that Council District 6 is the heartland of CD 4’s Democratic voters. While it has less than a 3% advantage over Council District 7 in registered Dems, it has a 10.6% lead over the same district in two-time primary voters–23.8% versus 13.2%. No wonder Dereck Davis is thinking about running. (Notice also that Council District 5 leapfrogs ahead of Council District 7 in this table.)

Among state legislative districts, the biggest drop is in D47, which has 2.2% fewer two-time primary voters than registered Dems. Legislative Districts 24 and 25 have a slightly higher share of two-time primary voters than registered Democrats. But the statistics change less dramatic; the increase is 0.7% for D24 and 0.2% for D25. In contrast, the share of two-time primary voters is lower the registered Dems by 0.6% in D26.

Based on this table, the most desirable pieces of real estate to have represented before in terms of Democratic primary turnout are:

1. Maryland (Brown)
2. Prince George’s County (Ivey)
3. Prince George’s County Council District 6 (Derrick Davis)
4. State Legislative District 24 (Barron)
5. State Legislative District 25 (Dereck Davis/Brown)
6. Anne Arundel County
7. Prince George’s County Council District 5
8. State Legislative District 26 (Walker/Muse)
9. Prince George’s County Council District 7
10. Prince George’s County Council District 8
11. State Senate District 47
12. State Legislative District 33
13. State House District 47A
14. Prince George’s County Council District 1
15. State Legislative District 21 (Peña-Melnyk)

Share