Category Archives: turnout

Where are the Republicans?

The geographic nature of partisan polarization in Maryland results in radically different distributions of Democratic and Republican primary voters. On Friday, I took a look at the Democrats. Today, it’s the turn of the Republicans.

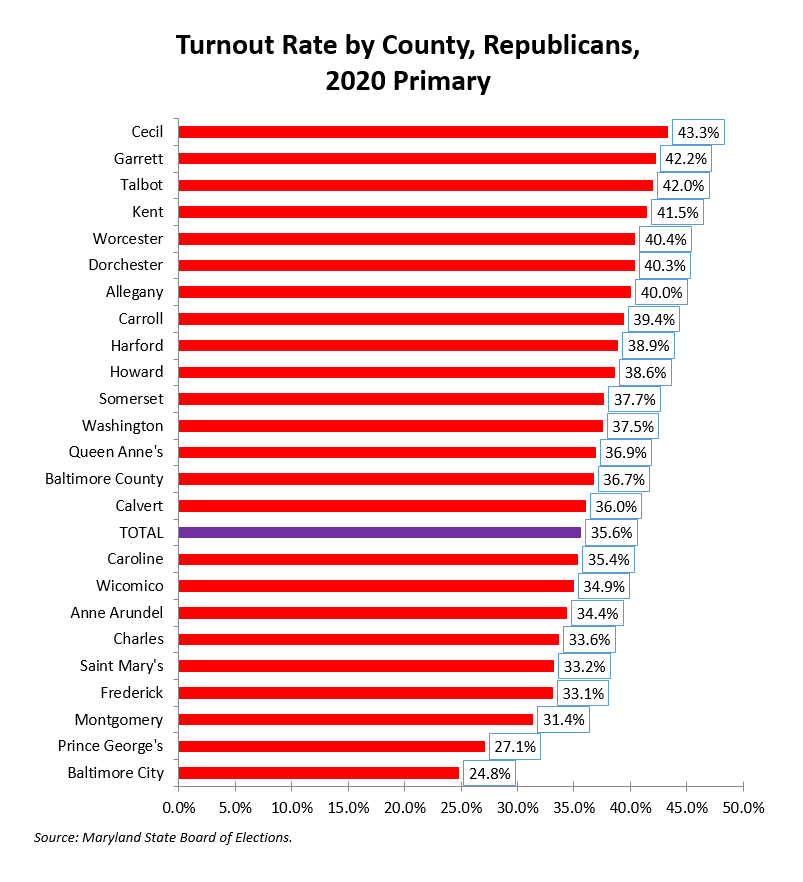
While only a desultory 7.7% of Democratic primary voters in 2018 lived on either the Eastern Shore or in the Western 3 (Garrett, Allegany and Washington Counties), 19.2% of Republican primary voters lived in the same areas. That looks to increase in 2022 as the share of eligible Republicans in the two regions has grown to 20.8% from 19.4%.

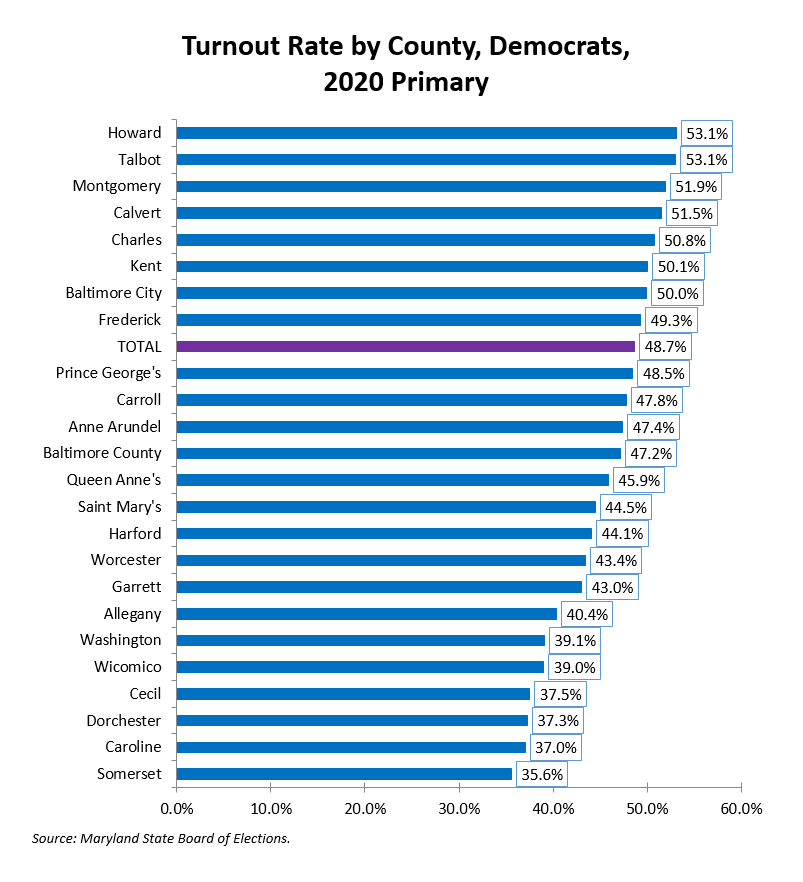
This pattern reflects a continuation of Republican growth in rural areas that characterized shifts generated by Donald Trump’s two White House bids. So does the shift away from Republicans in more urban parts of the state, especially in the educated and racially diverse Washington suburbs. Montgomery was home to 20.0% of Democratic primary voters in 2018 but only 11.2% of Republicans.

That gap looks to grow as the Montgomery’s share of eligible Democrats has grown 0.3% but its share of Republicans has dropped by 1.2%. Differences are even starker in neighboring Prince George’s, which is now home to 20.8% of Democratic eligible voters but only 3.8% of Republicans. Put another way, Prince George’s casts fewer Republican primary votes than Washington County despite being home to six times as many total residents.

Driven by the weight of suburban Republican populations, the Baltimore metro area punches harder in Republican than Democratic primaries. Baltimore County increasingly tilts Democratic but it has a strong Republican presence and Gov. Larry Hogan carried it handily in his two gubernatorial wins. It is home to 14.0% of eligible Republican voters, the highest share in the state.

Anne Arundel is next with 13.2% of all Republicans. Meanwhile, the considerably smaller but ultra Republican exurbs of Carroll and Harford Counties together are home to 14.4% of Republicans. Carroll is the arguably the most right-wing area of the state and Trumper Del. Dan Cox will hope to do well there. Both Cox and his main challenger, Kelly Schulz hail from Frederick, which has 6.8% of Republican voters.

In short, while Democratic candidates will need to spend most of their time camped out in the most densely populated portions of the State, Republicans must get travel more because their voters are far less concentrated. It may also help explain partisan differences in the regional focus of priority transportation projects.

Share

Where are the Democratic Votes?

Source: Maryland State Board of Elections.

Maryland has closed primaries, which means that only registered members of a party can vote in its primary. Partisan leanings vary tremendously around the state, so the share of a county’s primary voters often differs quite a bit from its population share.

The above table shows the share of all statewide Democratic primary voters in the 2018 Democratic primary as well as eligible voters (i.e. registered Democrats) at that time and now. Together, Prince George’s and Montgomery made up two-fifths of Democratic primary voters in 2018. Despite being considerably smaller in population than Montgomery, Prince George’s has the same share of voters because it leans even more heavily Democratic than Montgomery.

However, if turnout patterns remain the same, Montgomery looks to ease past Prince George’s next year as the gap in eligible voters has closed by 0.5 points and Montgomery voters turn out at a higher rate than those in Prince George’s. In 2018, Montgomeryites were 18.0% of eligible Democrats but 20.0% of Democratic voters. Prince Georgians formed 21.0% of those eligible but only 20.2% of voters.

Today, Baltimore and its inner suburbs (Baltimore County, Anne Arundel and Howard) are have a slightly higher share of eligibles (40.6%) than the two big D.C. area powerhouses (39.1%). But unless Baltimore City ups its turnout game, the region’s share of Democratic primary voters will lag behind that of the inner D.C. suburbs as they did in 2018.

In the metropolitan areas, which include outer suburbs, Washington (46.7%) now has more eligibles than Baltimore (45.5%). In 2018, the Washington Metro already beat the Baltimore Metro in the share of all Democratic voters by over three points–47.8 to 44.6. This lead is likely to continue to slowly expand as D.C. is now growing faster than Baltimore and becoming even more heavily Democratic. In Montgomery, Trump’s share of the vote dropped from 33% in 2016 to 19% in 2020.

The Eastern Shore and the Western 3 (Garrett, Allegany and Washington) together form only 7.6% of eligible Democratic voters and are consequently almost an afterthought for statewide candidates except during the Tawes Crab and Clam Bake.

We’re also a long way from the days when the Baltimore area, let alone Baltimore City, dominated the state. Among Democratic primary voters, D.C. has already surpassed Baltimore with the lead looking to continue to grow slowly but steadily.

Share

MoCo Turnout 2020: Party Splits

By Adam Pagnucco.

Eighty percent of MoCo voters turned out in the 2020 general election, about average for a presidential year. In splicing the data, I did not find large variations in turnout rate by geography. The highest turnout was in Leisure World (85%) and the lowest was in Glenmont/Norbeck (73%). But there was significant variation in party turnout by area, demonstrating one of MoCo’s least appreciated characteristics: its political heterogeneity.

MoCo is thought of as a blue county, and at first glance, it is. All of the county’s partisan elected officials have been Democrats since 2006 and Democratic candidates for statewide office and president have won here for decades. But there are big political differences between parts of the county. For example, while Takoma Park is one of the most progressive areas in the United States, Republicans are competitive in Damascus.

The charts below show the percentage of MoCo voters who were Democrats, Republicans and unaffiliated or third party voters in the 2020 general election. The source of the data is the State Board of Elections. (See here for my methodology and definitions.) This information shows the differences in party participation by area.

Democrats

Democrats comprised 70% or more of the voters in the Democratic Crescent (the areas inside and near the Beltway), Downtown Silver Spring, Takoma Park and most of east county. Crescent voters play out-sized roles in Democratic primaries and were key to depressing Governor Larry Hogan’s MoCo vote percentage in 2018. Democrats were less dominant in upcounty and fell short of a majority of voters in Dickerson, Poolesville and Damascus.

Republicans

Republicans were just 15% of actual voters countywide. But they accounted for a quarter or more of voters in some parts of upcounty and were a third or more in Dickerson, Poolesville and Damascus. While the GOP has some pockets of influence here, they are in long-term decline in MoCo as I will discuss in a future post.

Unaffiliated/Third Party

Of the 156,702 eligible MoCo voters who were not Democrats or Republicans, 147,417 (94%) of them were unaffiliated. Unaffiliated and third party voters together accounted for 21% of actual voters, more than the Republicans. It’s probably not a coincidence that North Potomac, Clarksburg and Potomac had the highest percentages of these voters as those areas have concentrations of Asian residents. Many Asian voters don’t choose party affiliation and they tend to be politically diverse. It remains to be seen how the Trump presidency will affect their party choices in registration and voting over the long term.

One effect Trump did have was to stimulate a surge in voting among MoCo Democrats, as we will explore in a future post. There was also a lot of partisan activity around the four county ballot questions last year which gave the Democratic Party a lot of influence over their chances of success. That may not always be the case in the future, and if it’s not, Republicans and unaffiliated voters can still play a role in coming general elections.

Share

Turnout by County: 2020 Primary, Part Three

By Adam Pagnucco.

In Part One, we looked at overall turnout rate by county. In Part Two, we examined turnout rate by party. This post compares turnout between 2016 and 2020.

The chart below shows change in turnout rate between the 2016 and 2020 primaries. This one is a bit tricky. The counties in red (Allegany, Anne Arundel and Caroline) allowed unaffiliated voters to vote in 2020 but not in 2016. Therefore, since unaffiliated voters turn out at lower rates than party members, these counties’ turnout change is skewed downward. The counties in green (Cecil, Kent, Saint Mary’s and Worcester) allowed unaffiliated voters to vote in 2016 but not in 2020. Their turnout change is skewed upward.

Throw out the counties which allowed unaffiliated voters to vote in one year but not the other and this trend emerges: the four jurisdictions in which turnout went up the most – Prince George’s, Charles, Baltimore City and Montgomery – are all heavily Democratic and have large populations of color.

Overall, the two parties are headed in different directions.

Statewide Democratic turnout increased from 44.1% in the 2016 primary to 48.7% this year. Every county except Allegany, Frederick, Garrett, Howard and Washington saw increases in the Democratic turnout rate. One might have expected 2016 turnout to be higher among Democrats because Bernie Sanders had not yet dropped out by the time Maryland voted (on April 26). Nevertheless, 2020 primary turnout was higher despite Sanders suspending his campaign months before Maryland’s election day (June 2).

Statewide Republican turnout fell from 46.5% in the 2016 primary to 35.6% this year. Every county in the state saw a decline in Republican turnout. This was probably affected by the fact that the 2016 Republican primary was still semi-competitive when Maryland voted on April 26 whereas the 2020 Republican primary has not been competitive at all.

Overall, the picture of significant turnout increases in majority-black jurisdictions like Prince George’s and Charles counties along with falling Republican turnout across the board should not be encouraging to the GOP. Maryland looks poised to see tons of Democratic voters rushing to the polls (or more likely, the mailbox) to demonstrate their fury against the current occupant of the Oval Office. One wonders how this will affect the various ballot questions and charter amendments across the state, especially the ones in Montgomery County.

Share

Turnout by County: 2020 Primary, Part Two

By Adam Pagnucco.

Part One showed the overall turnout rate by county in the 2020 primary but that statistic conceals numerous nuances. Today, we will look at turnout by party. Let’s start with the Democrats.

Every Maryland county had higher turnout among Democrats than among voters overall except Cecil, Dorchester and Somerset. Jurisdictions with the lowest Democratic turnout rates tend to be dominated by the GOP.

The chart below shows turnout rate among Republicans.

The most obvious fact here is that statewide turnout among Republicans (35.6%) was significantly lower than among Democrats (48.7%). In fact, in every county except Cecil, Dorchester and Somerset, the turnout rate among Democrats was higher than among Republicans. Granted, with the exception of a contested county executive primary in Cecil County, Republicans don’t have much to vote for because their incumbent president had little primary competition. But something similar could be said for Democrats outside Baltimore City.

The chart below shows turnout rate among unaffiliated voters.

Only 11 counties allowed unaffiliated voters to vote in the 2020 primary. Since Maryland has closed primaries, unaffiliated voters cannot vote in party primaries but they can vote in primaries held for non-partisan offices. Among the counties allowing unaffiliated voters to vote this year, all had non-partisan school board races on the ballot except Washington County, which held non-partisan primaries for municipal offices in the City of Hagerstown.

In Part Three, we will examine change in turnout between 2016 and 2020.

Share

Turnout by County: 2020 Primary, Part One

By Adam Pagnucco.

The 2020 primary is behind us and the ballots will go out soon for the general election. With few local races going on in the state but a historic presidential election coming, how did Maryland counties do on turnout?

First, let’s look at the final turnout percentage by county in the 2020 presidential primary. Jurisdictions in green had races on the ballot for which unaffiliated people could vote while jurisdictions in blue did not.

It’s not a coincidence that the bottom six counties had non-partisan races on the ballot for which unaffiliated voters could vote. Unaffiliated voters turn out at lower rates than party members, so when they are included in a voting population, the overall turnout rate is skewed downward. Baltimore City’s status as number one is due to the fact that it elects its mayor, comptroller and city council members in presidential years, an unusual practice for local jurisdictions in Maryland.

In Part Two, we will look at turnout by party.

Share

Top Seventh State Stories, May 2020

By Adam Pagnucco.

These were the top stories on Seventh State in May ranked by page views.

1. Miscreants Run Wild at Elrich Press Conference
2. MoCo is a Turnout Outlier
3. MoCo’s Nasty School Board Race, Part One
4. MoCo’s Nasty School Board Race, Part Two
5. MoCo’s Nasty School Board Race, Part Three
6. Who Signed the Anti-Austin Letter – and Who Did Not
7. How MoCo Can Balance Public Health and the Economy
8. Turnout Off to Slow Start
9. Campaign Finance Reports, School Board Primary
10. Elrich’s Hidden Tax Hike

For the most part, the leaders reflected the two big stories of the month: MoCo’s mud-splattered school board contest and the county’s low turnout in the primary. (It turns out that despite early data from the State Board of Elections, MoCo probably won’t be last in the state.) Also, the county deserves credit for posting a COVID-19 dashboard just two days after we called for one.

June promises to be another busy month. Thank you for reading Seventh State!

Share

Updated Turnout: MoCo is Low but not Last

By Adam Pagnucco.

In the days leading up to the primary election, turnout reports from the State Board of Elections consistently showed MoCo as last in the state. Updated numbers released this morning now show MoCo is one of the lower turnout jurisdictions in Maryland but no longer last.

The chart below shows the combined return rate of vote by mail ballots and absentee ballots. (Vote by mail ballots dominate this statistic as 3,485,891 of those were sent to voters while 99,718 absentee ballots were sent to voters statewide.) The state has so far not released turnout counts for election day votes.

MoCo now ranks 21 of 24 jurisdictions in turnout in these two categories. Baltimore City, despite huge problems with late ballots and counting in City Council District 1, ranks first. That’s a testament to city voters who decided Baltimore’s future in this election.

In terms of party splits, MoCo ranked 13th of 24 in Democratic turnout, 23rd of 24 in Republican turnout and 5th in unaffiliated/third party turnout among the 13 jurisdictions that received ballots from those voters.

MoCo was also one of the lower turnout jurisdictions in the 2016 primary as shown in the chart below.

In addition to turnout, another issue is how long it is taking to count ballots. At the moment, the county has received 227,383 in combined vote by mail and absentee ballots along with an indeterminate number of election day ballots. At the moment, 137,060 ballots for president have been counted and 124,764 ballots for at-large school board have been counted. That means the county board of elections has a ways to go before all ballots are counted. The board has scheduled canvasses through June 20.

Share

Vote, MoCo, Vote!

By Adam Pagnucco.

Just as I reported yesterday and the day before, MoCo’s rate of returning vote-by-mail ballots remains the lowest in the state. The chart below shows return rate by county through May 29.

The data is also bad when looking at party splits. MoCo’s return rate among Democrats (10.2%) is the worst in the state, which had a return rate among Democrats of 19.6%. MoCo’s return rate among Republicans (8.6%) was also the worst in the state, which had a return rate among Republicans of 20.2%. MoCo is one of thirteen counties in which unaffiliated and third party voters vote in presidential primaries. Among those thirteen, MoCo’s return rate among unaffiliated and third party voters was 5.0%, ranking 9th and not much lower than the statewide rate (6.0%).

As if that were not enough, MoCo is also last in return rate of absentee ballots. Even though the state sent 3,488,628 regular ballots to voter addresses, an additional 97,373 absentee ballots were requested and mailed. MoCo’s return rate of absentee ballots was the worst in the state among Democrats, Republicans and unaffiliated and third party voters. Here is an interesting fact: despite having about a sixth of the state’s population, MoCo voters requested a third of all absentee ballots in the state.

I’m not going to speculate on what is happening here. But with 4 days to go until election day, MoCo’s abysmal turnout rate has emerged as a consistent trend which has not yet gone away.

In the meantime, if you have received your ballot, don’t let it sit with the bills and junk mail. Fill it out and vote!

Share

MoCo is a Turnout Outlier

By Adam Pagnucco.

Yesterday, I published turnout data through May 26 showing that MoCo was dead last in Maryland. Today, I am publishing turnout data through May 28 showing the same thing. Folks, with 5 days to go until election day, it’s time to wonder what’s going on.

On May 26, 3.9% of those who received a mail ballot in MoCo were recorded as returning it. The return rate for the state was 14.1%. On May 28, MoCo’s return rate was 6.5%, still lagging the state’s rate of 16.5% and still the last in Maryland.

Compare MoCo to Frederick. On May 26, MoCo’s return rate was 3.9% and Frederick’s was 6.4%. On May 28, MoCo’s return rate was 6.5% and Frederick’s was 11.2%.

Another comparison worth noting is Baltimore City, which was plagued with late mailouts of ballots. The city’s return rate was 12.1% on May 26 and 13.7% on May 28, far higher than MoCo.

It’s worth noting that MoCo had one of the lower turnout rates in the state in the 2016 primary, although it was not at the bottom.

So what’s going on here? It’s a little early to say. Stories of folks getting late ballots or even getting ballots for people no longer living at their address are common on social media here. The county boards of election could also have different processing times for ballots. (David Lublin described how this works earlier today.) Or it could all be a timing fluke and MoCo could wind up in the bottom quarter of turnout, but not be an outlier, as happened four years ago.

If you’re concerned about this, the best thing to do is vote!

In the meantime, we will keep watching this data.

Share