
Montgomery County badly needs more political coverage, so I am very glad that Adam Pagnucco has gotten back to blogging now that the primary is over. Adam has started his own new site, Montgomery Perspective. His past posts on Seventh State will remain up here but you can also view them over at his new digs. I wish Adam all the best with his new blog and am sure that it will be well worth reading.
Tag Archives: Adam Pagnucco

Farewell For Now
By Adam Pagnucco.
Dear readers, this will be my last post on Seventh State for the foreseeable future. That’s because I am joining David Blair’s campaign for county executive. I can’t work for a campaign and simultaneously write about it, or issues connected to it, for the public. So it’s time for me to go, at least for now.
To our readers: thank you. In my early days of writing more than a decade ago, it felt like I was throwing messages in bottles out to sea. Off the bottle would go into the deep waters, and who knew if anything would return. But that began to change as more and more of you contacted me to discuss our content. You showed me that MoCo residents are the smartest, most thoughtful and most interesting people on Planet Earth. Sure, I produced the content, but you educated me, challenged me and ultimately improved my work in return. YOU are responsible for the success of Seventh State.
And now to the founder of Seventh State, David Lublin. It’s not easy to be my partner. I am sure David has heard many, MANY complaints about me over the years. He is just too nice to say so! David, thank you for giving me an opportunity to contribute to this county. Thank you for putting up with me and offering me the wisest of counsel over the years. Most of all, thank you for being my friend.
That’s all for now. See you on the campaign trail!
It’s Hard to Beat Incumbents
By Adam Pagnucco.
Recently, Bethesda Beat kicked off the primary season with news that County Executive Marc Elrich and most of the county council are running for reelection. That’s not surprising and there will be plenty more news to come. But for the moment, let’s start with this general observation.
It’s hard to beat incumbents.
This may be the least surprising statement in all of politics, but it bears repeating for each new crop of candidates who come along. Opensecrets.org charts incumbent performance in Congress and finds their win rates generally in the 80-90% range for decades. And since the passing of President Franklin Delano Roosevelt, 8 of 12 U.S. presidents who ran for reelection won.
Montgomery County is no exception to this rule. The table below shows MoCo incumbent performance for county and state legislative offices over the last 7 cycles. During that period, MoCo incumbents won 90% of their reelections to their current seats. (The data does not show performance in runs for higher office.)
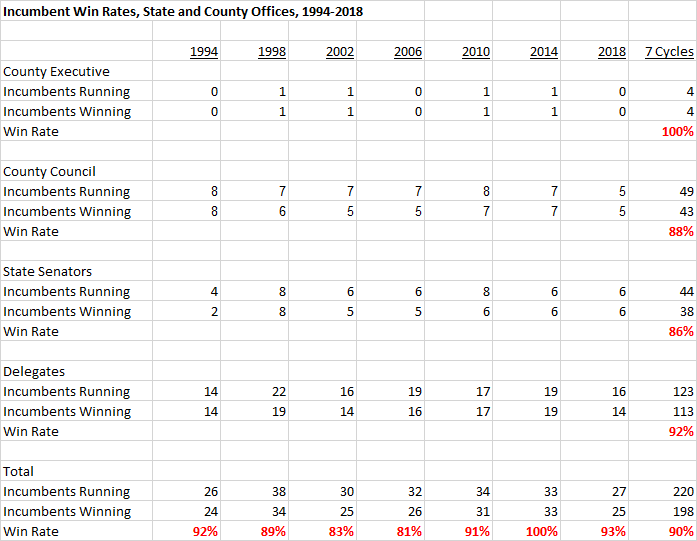
Incumbents might be getting stronger here over time. Over the last two cycles, only two incumbents – Delegates Marice Morales (D-19) and Shane Robinson (D-39) – lost reelection. Incumbent county council members and state senators won every reelection race in 2014 and 2018. As for county executive, incumbents have run for reelection seven times since the office was established in 1970. Only once, when five-term Council Member Neal Potter knocked off County Executive Sidney Kramer in 1990 with 52% of the vote, was an incumbent executive defeated.
Incumbents have so many advantages: money, relationships, knowledge of the job, policy and political experience, records of performance… it goes on and on. Rather than asking why they win, it’s more interesting to ask why they sometimes lose. I asked that question in a five-part series in 2010 that still holds up today. In MoCo, incumbents typically lose for one of four reasons: they are Republicans (not a factor today!), they get lazy and take their races for granted, they make too many enemies in their districts and – the rarest reason of all – they draw historically great challengers.
Back in 2010, I identified just four great challengers in recent years: Chris Van Hollen (who beat District 18 Senator Pat Sher in 1994 and longtime Congresswoman Connie Morella in 2002), Phil Andrews (who beat County Council Member Bill Hanna in 1998), Rob Garagiola (who beat District 15 Senator Jean Roesser in 2002) and Jamie Raskin (who beat District 20 Senator Ida Ruben in 2006). I will add Roger Manno to that list, who defeated District 19 State Senator Mike Lenett in one of the wildest MoCo races ever in 2010. If you include Congressional District 4, which once had part of east MoCo in it, then Donna Edwards deserves to be on the list for almost taking out Congressman Al Wynn in 2006 and then crushing him two years later.
Here is something I hear in every cycle. Politician X is a freshman incumbent who won his seat by a small margin last time. So inevitably X must be vulnerable in a reelection race, yeah? Actually, this is almost always WRONG. Let’s take District 5 Council Member Tom Hucker for example. A two-term delegate and founder of Progressive Maryland, Hucker won a surprisingly close race over civic activist Evan Glass and three other candidates by 222 votes in 2014. For the next four years, all I heard was “Hucker is vulnerable.”
Silly rabbits! Hucker is a pro. He knows the business. He hired good people, paid attention to constituent service, raised money, voted with his district and locked it down. In 2018, he won by 45 points because – among other things – he knows how to capitalize on being an incumbent. For those of you who think freshman Council Member Andrew Friedson is vulnerable just because he won 28% of the vote in his crowded first race, pay attention. Things tend to change when you’re an incumbent and you know how to be one.
Does this mean incumbents inevitably win? Certainly not – as the table above shows, they have lost 22 times in MoCo since 1994. But let’s be realistic: in MoCo, in Maryland, in the United States and probably in the rest of the Milky Way Galaxy, it’s hard to beat incumbents.
Downcounty Dominates Public Financing, Part Five
By Adam Pagnucco.
Part Four illustrated the significant flows of political contributions from downcounty to candidates in public financing. Today, we shall see which communities lagged behind.
Gaithersburg
Gaithersburg combines an incorporated area with a municipal government and an unincorporated area administered directly by the county. Zip codes in the incorporated and unincorporated areas together account for roughly 14% of the county’s population, and along with Germantown, comprise one of the two biggest population centers in upcounty.
The table below shows amounts and percentages of fundraising from Gaithersburg by executive and council at-large candidates who qualified for matching funds. Winning candidates are shown in red.
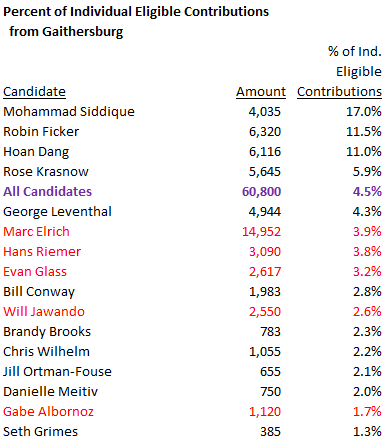
Despite its size, Gaithersburg accounted for less than 5% of individual contributions eligible for matching funds. Gaithersburg’s population is slightly larger than the combined populations of Bethesda, Chevy Chase and Kensington. Residents of those areas gave $358,885 to publicly-financed candidates while Gaithersburg residents gave $60,800.
Germantown
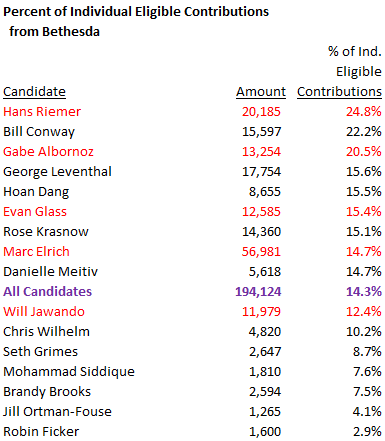
Germantown’s zip codes account for roughly 9% of the county’s population but its residents donated less than 2% of the in-county individual contributions received by candidates in public financing. Germantown’s population is larger than Bethesda’s. Nevertheless, Bethesda residents contributed $194,124 to publicly financed candidates while Germantown residents gave $26,080.
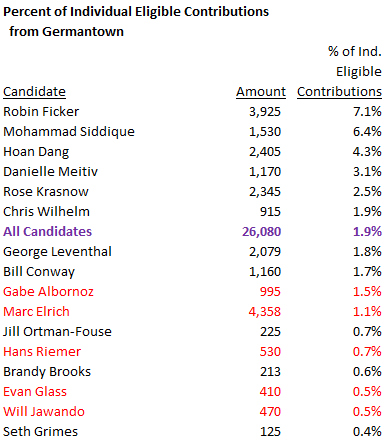
The tables below shows areas with significant population but lower than average participation rates in public financing. Note their concentration in upcounty and east county.
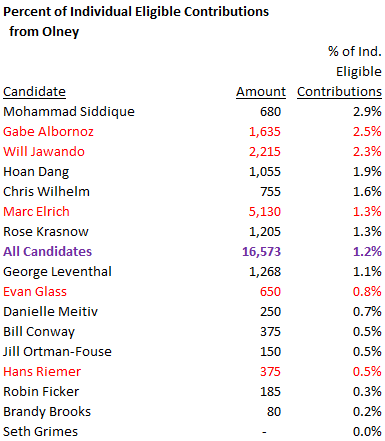
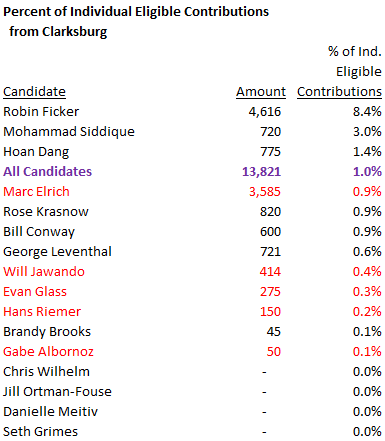
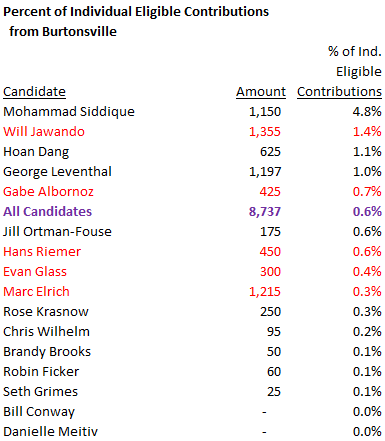
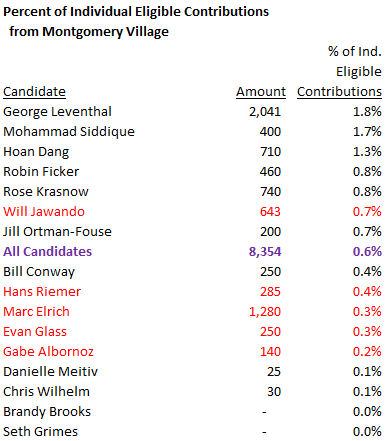
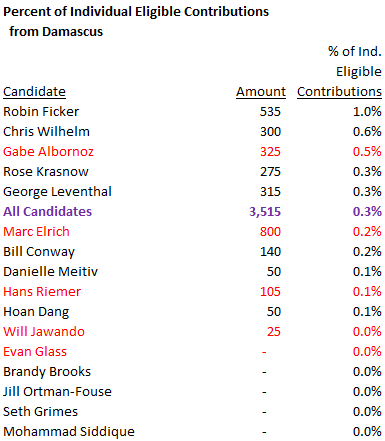
Public financing is here to stay and many – perhaps even most – county politicians will use it. Politicians go where the money is and they tend to be particularly attentive to constituencies who contribute. Right now, this system favors downcounty, where concentrations of contributors and high-frequency voters tend to be located. If other parts of the county want to get equal attention, they are going to have to run some candidates and get behind them with money and votes.
Downcounty Dominates Public Financing, Part Four
By Adam Pagnucco.
There were huge differences in public financing participation by geography in 2018. In some areas, residents donated significant amounts of money to publicly-financed candidates which were enhanced by matching funds paid out by the county. In other areas, residents contributed very little to publicly-financed candidates. These areas match existing patterns of political influence that were greatly amplified through distributions of matching public funds.
Let’s start with downcounty, hereby defined as the Democratic Crescent that sent Jamie Raskin to Congress. Downcounty is diverse in terms of demographics and economics but it is characterized by moderate to high turnout rates in Democratic primaries, high degrees of civic organization and lots of progressive activism.
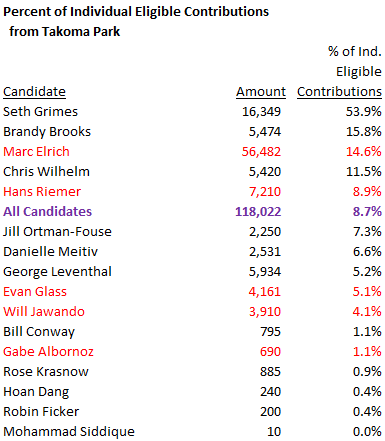
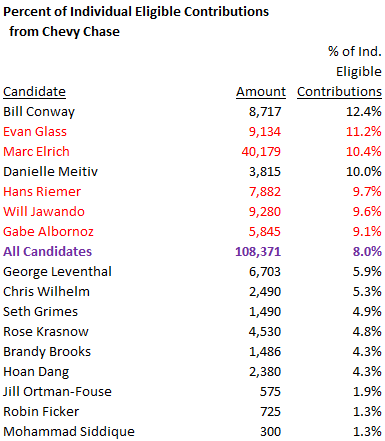
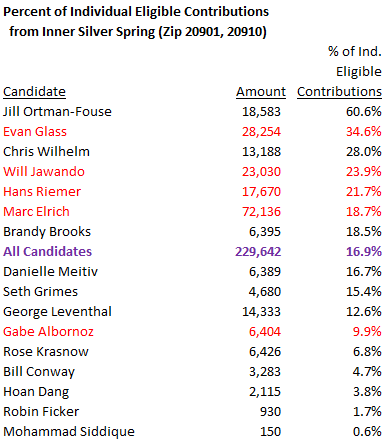
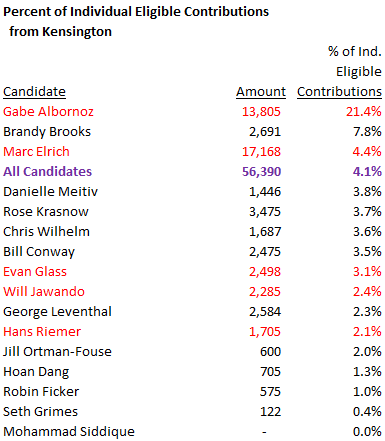
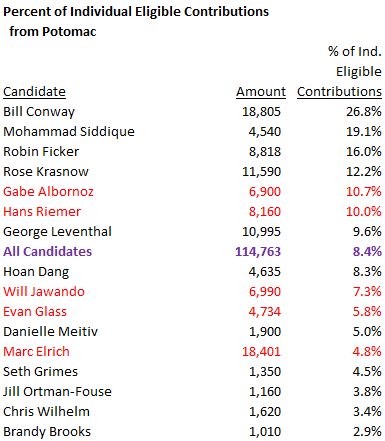
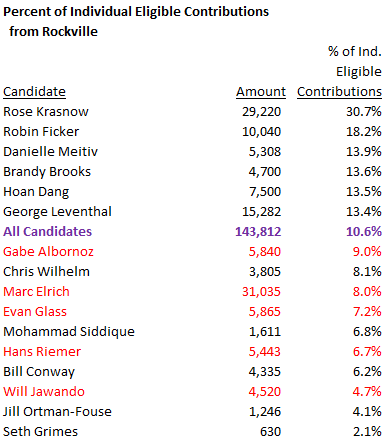
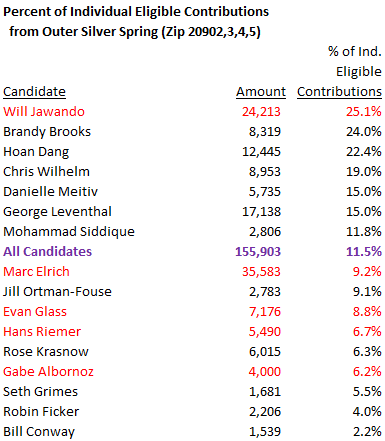
The downcounty areas shown below have two things in common. First, all of them exceeded per capita averages of individual contributions to publicly-financed candidates. Second, the winning candidates (Marc Elrich for executive and Hans Riemer, Will Jawando, Evan Glass and Gabe Albornoz for council at-large) tended to receive higher percentages of their campaign funding from these areas than most of the losing candidates. That makes sense – under public financing, fundraising and voting tend to go together. The tables below show amounts and percentages of fundraising by downcounty area for executive and council at-large candidates who qualified for matching funds. Winning candidates are shown in red.
All five downcounty areas participated a lot in public financing. Below are three populated areas located neither in downcounty nor in upcounty that had neither really high nor really low participation rates in public financing.
In Part Five, we shall see which areas disproportionately did not participate in public financing.
Elrich: Maybe We Don’t Need Developers
By Adam Pagnucco.
Last week, Bethesda Beat reported that County Executive Marc Elrich was seeking a developer to partner with the county on redeveloping White Flint, an area that has fallen far short of its potential over the last decade. That sounds like a good idea except for this: Elrich said in a public forum just three days before that maybe the county should not partner with developers at all.
Yes, dear reader, you read that correctly!
Elrich was a panelist at a forum held by the Housing Association of Nonprofit Developers on affordable housing on March 9. In response to a question from the moderator about the difficult economics of affordable housing, Elrich said this:
Part of me wonders whether we ought to be looking at not partnering with developers but just partnering with construction companies, where basically, here’s the – I want to build a building. What’s the price? I modified my own house, I have lots of experience in this. But I also did three tenant conversions in Takoma Park while I was a council member in Takoma Park and, you know, we took – there was no developer involved. We just looked at what’s the cost of the building, the units, what’s the cost of bringing in repair, and we dealt with it as a straight up transaction and we took anybody out of it who was going to take money out of the project in addition to the costs of just doing the physical work. And you know, it may be that we look more toward builders on a contract basis rather than developers. Because then I don’t have to deal with their rate of return.
You can see this at 1:25:37 of the video below.
Let’s remember that this was said not on a street corner or in a restaurant but during a forum for developers. One can reasonably assume that many of them heard the county executive loud and clear.
These remarks are problematic for two reasons. First, they fail to recognize what developers actually do. They don’t just oversee construction contractors. They analyze market economics; hire architects and engineers; design the project; obtain financing; go through land use, transportation and environmental reviews; negotiate with the community; market the property and/or hire agents to market it; manage the property or hire a property manager (if they continue to own it) and more. Construction contractors tend not to do those things, because if they did, they would be… developers. Eliminate developers from project development and who is going to do all of the above? County bureaucrats? Good luck in saving any money that way.
Second, it is totally banana cakes to publicly say that the county is looking to partner with a developer in White Flint and then to wonder out loud – in front of developers – whether the county should be partnering with developers at all. That’s right, developers, you are invited to partner with an elected official who believes that maybe you should not be on the project. Who is going to take that deal?
Anyone want to place any bets on when White Flint gets done?
Downcounty Dominates Public Financing, Part Three
By Adam Pagnucco.
In Part Two, we learned that downcounty accounts for less than one-quarter of the county’s population but comprised 52% of individual contributions eligible for matching funds to countywide candidates in 2018. Let’s look at the contribution geography of the candidates who won countywide offices and used public financing that year.
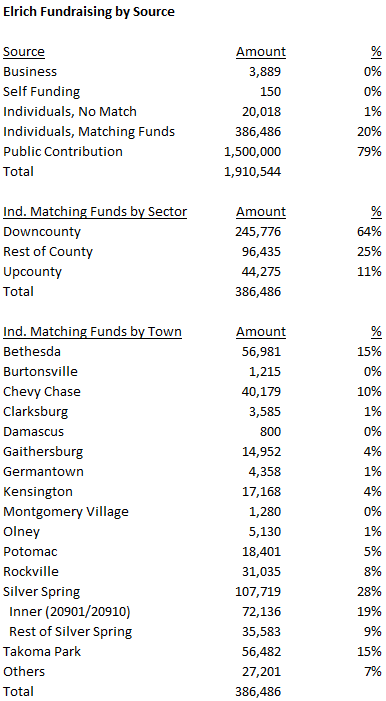
Marc Elrich
Elrich was a city council member in Takoma Park from 1987 through 2006 and an at-large member of the county council from 2006 through 2018. He was elected county executive for the first time two years ago. He raised more money in public financing than anyone else because of two factors: 1. county executive candidates have more generous matching formulas than council candidates, and 2. he had a competitive general election that necessitated more fundraising. In both the primary and the general, Elrich hit the matching funds cap of $750,000 for each election.
Elrich received $386,486 in individual contributions from county residents. Subject to the $750,000 caps, these contributions were eligible for public matching funds. Of the $386,486 in eligible contributions, 64% came from downcounty, higher than the all-candidate average of 52%. Elrich’s biggest sources of fundraising were inner Silver Spring (19%), Bethesda (15%) and Takoma Park (15%). Only 11% of Elrich’s eligible individual contributions came from upcounty.
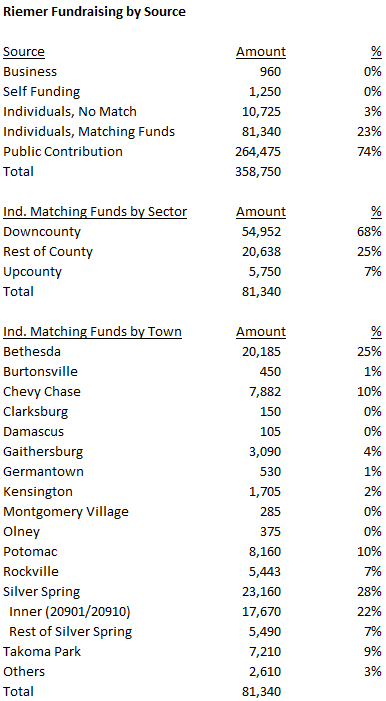
Hans Riemer
Riemer has been an at-large council member since 2010. He was the only at-large incumbent who ran for reelection in 2018, a crucial advantage that helped him finish first in the primary. He is prevented by term limits from running for reelection to his current seat but he is free to run for other offices.
Riemer received $81,340 in individual contributions from county residents. Of these, 68% came from downcounty, higher than the all-candidate average of 52%. Riemer’s biggest sources of fundraising were Bethesda (25%), inner Silver Spring (22%) and Chevy Chase and Potomac (10% each). Only 7% of Riemer’s eligible individual contributions came from upcounty.
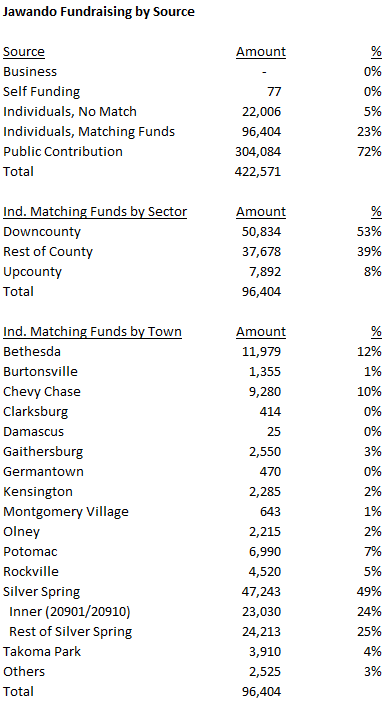
Will Jawando
Jawando ran for Delegate in District 20 in 2014 and he ran for Congress in District 8 in 2016. He finished second in the 2018 council at-large primary. Jawando raised more money than any other council candidate in public financing but has nonetheless chosen to use traditional financing in this cycle.
Jawando received $96,404 in individual contributions from county residents. Of these, 53% came from downcounty, about the same as the all-candidate average of 52%. Jawando’s biggest sources of fundraising were outer Silver Spring (25%), inner Silver Spring (24%) and Bethesda (12%). Only 8% of Jawando’s eligible individual contributions came from upcounty.
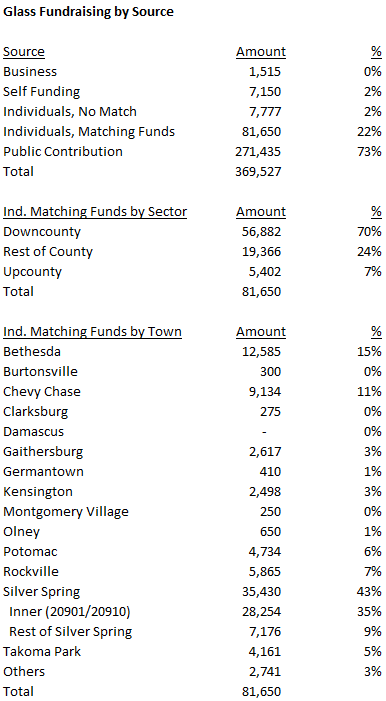
Evan Glass
Glass was a long-time civic leader who ran for the District 5 council seat in 2014 and barely lost to then-District 20 Delegate Tom Hucker. He finished third in the 2018 council at-large primary.
Glass received $81,650 in individual contributions from county residents. Of these, 70% came from downcounty, higher than the all-candidate average of 52%. Glass’s biggest sources of fundraising were inner Silver Spring (35%), Bethesda (15%) and Chevy Chase (11%). Only 7% of Glass’s eligible individual contributions came from upcounty.
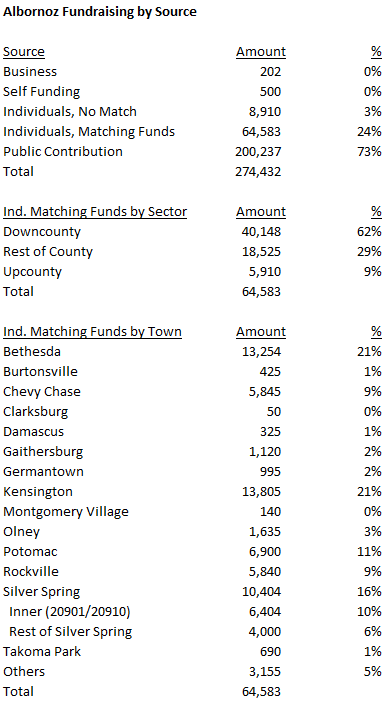
Gabe Albornoz
Albornoz was the county’s director of recreation for 12 years and is a former chair of the county’s Democratic Party. He finished fourth in the 2018 council at-large primary.
Albornoz received $64,583 in individual contributions from county residents. Of these, 62% came from downcounty, higher than the all-candidate average of 52%. Albornoz’s biggest sources of fundraising were Kensington (21%), Bethesda (21%) and Potomac (11%). Only 9% of Albornoz’s eligible individual contributions came from upcounty.
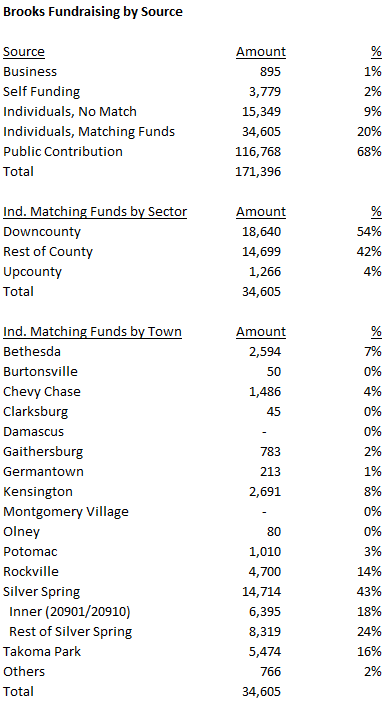
Brandy Brooks
Brooks was a new resident in the 2018 cycle, having registered to vote in Maryland in April 2016. She picked up a number of important endorsements and ran a strong race, ultimately finishing seventh in the 2018 council at-large primary. Even though Brooks didn’t win, she is in this list because she is running again and is off to a fast head start.
Brooks received $34,605 in individual contributions from county residents. Of these, 54% came from downcounty and 43% came from Silver Spring. Despite receiving just 4% of her contributions from upcounty, Brooks finished fourth there with a second-place showing in Montgomery Village.
The five winning candidates for countywide office, all of whom used public financing, have two things in common. First, all of them received a majority of their in-county individual contributions from downcounty, which accounts for less than a quarter of MoCo’s population. Second, none of them received more than 11% of their in-county individual contributions from upcounty despite the fact that roughly a third of MoCo residents live in upcounty.
This is as good a demonstration of downcounty’s political influence as any.
In Part Four, we will begin looking at who led in fundraising in each of the county’s major population centers.
Downcounty Dominates Public Financing, Part Two
By Adam Pagnucco.
Downcounty exerts a disproportionate impact in voting for countywide offices. It also exerts disproportionate influence in public financing. Let’s begin analyzing why that is.
The table below summarizes the types of contributions received by the four candidates for county executive and the 25 candidates for county council at-large who enrolled in public financing in 2018.
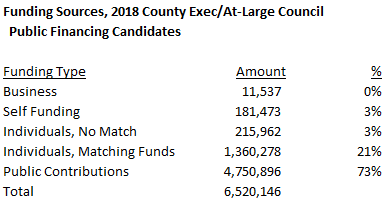
Receipts from businesses primarily relate to refunds, especially deposit refunds. They show up in public financing reports as contributions, but they are not true contributions in that they don’t add net financial value to campaigns. Self-funding of up to $12,000 (including money from spouses) is allowed for publicly financed candidates. Money received in the “individual, no match” category comes from individuals who live outside the county. Under the county’s public financing system, their contributions are not eligible for public matching funds. Money received in the “individual, matching funds” category comes from county residents. Their contributions ARE eligible for public matching funds. Finally, money received in the “public contributions” category are public matching funds. In 2018, 94% of all money received by publicly financed politicians came from individual contributions eligible for matching funds plus the matching funds distributed for them.
Because public matching funds are distributed through a formula tied to eligible individual contributions from county residents, it is the latter that is key to determining overall fundraising for publicly financed politicians. The more individual contributions from county residents, the more public matching funds the politician receives (subject to caps). As seen above, there are no other major sources of money available to candidates in public financing.
Now let’s look at where individual contributions from county residents that are eligible for public matching funds come from. The table below shows their distribution for each zip code with more than 10,000 residents. Again, this includes individual contributions from county residents to executive and council at-large candidates but not district council candidates (since they would skew the geography).
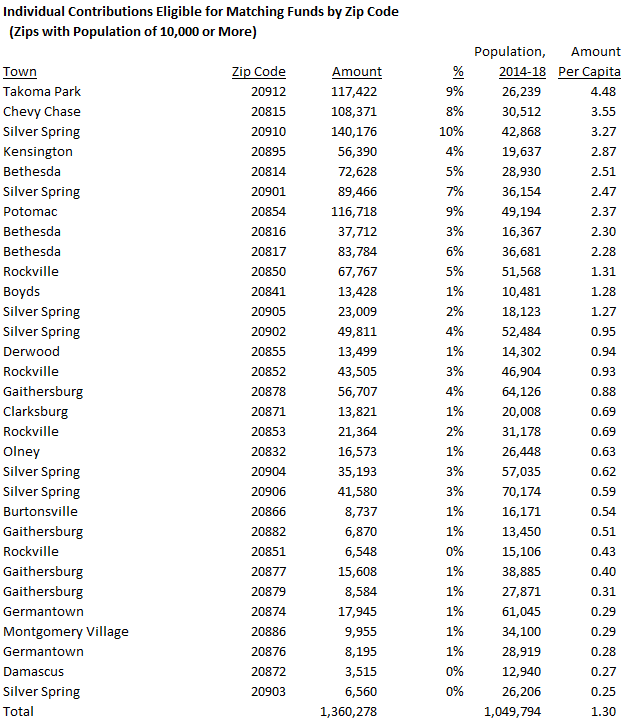
The average eligible individual contribution per capita was $1.30. In terms of per capita contributions, the top six zip codes, as well as eight of the top nine, were in downcounty. Takoma Park led the way at $4.48 per capita, more than three times the county average. (It’s probably not a coincidence that Marc Elrich, the top fundraiser in public financing and the winning candidate for county executive, is a long-time resident and former city council member in Takoma Park.) Six of the bottom seven zip codes in per capita contributions were in upcounty. The exception was zip code 20903, which has one of the lowest average household incomes in MoCo.
The table below summarizes individual contributions from county residents that are eligible for public matching funds by region.
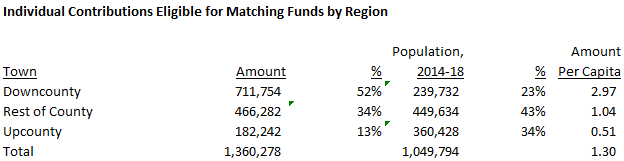
According to the U.S. Census Bureau, downcounty accounts for less than a quarter of the county’s population. However, downcounty donated 52% of individual contributions eligible for matching funds in 2018. Upcounty accounts for about a third of the county’s population but donated less than one-seventh of individual contributions eligible for matching funds in 2018. In per capita terms, downcounty residents contributed $2.97 each to publicly financed candidates, almost six times the per capita amount contributed by upcounty residents (51 cents).
It’s really no contest. Downcounty dominated public financing in 2018. Upcounty lagged badly.
In Part Three, we will discuss the fundraising geography of individual candidates.
Downcounty Dominates Public Financing, Part One
By Adam Pagnucco.
When Montgomery County passed public financing more than six years ago, many predictions were made. Public financing was supposed to empower small donors. (It did.) It was supposed to draw in more candidates for office. (It did.) It was supposed to reduce the influence of “special interests.” (That’s debatable.) But one of its biggest impacts was something no one predicted because it wasn’t on anyone’s radar when it was passed:
Public financing has amplified the political influence of downcounty.
In this series, we are going to investigate the geography of political contributions made in the county’s public financing system. That’s important because just as politicians pay special attention to the sources of their votes, they certainly pay special attention to the sources of their campaign contributions. Knowing where the money comes from greatly aids the understanding of our political system and public financing is no exception.
First, let’s discuss methodology. This series looks at public financing contributions to 2018 candidates for county executive and county council at-large. It excludes candidates for district council seats because their contributions naturally skew towards their districts. Of particular interest are individual contributions that are eligible for public matching funds. (We’ll explain more about this below.)
In terms of geography, we will look at towns, zip codes and two regions: downcounty and upcounty. Downcounty is defined as the “Democratic Crescent,” a term I coined that includes Takoma Park, Silver Spring (inside the Beltway), Chevy Chase, Kensington, Bethesda, Glen Echo and Cabin John. Because there are thousands of individual contributions, I am using zip codes 20901 and 20910 as proxies for Silver Spring inside the Beltway. Upcounty is defined as Ashton, Barnesville, Boyds, Beallsville, Brookeville, Clarksburg, Damascus, Dickerson, Gaithersburg, Germantown, Laytonsville, Montgomery Village, Olney, Poolesville, Sandy Spring, Spencerville and Washington Grove. Lots of communities, including but not limited to Rockville, Potomac, Wheaton, Glenmont, Burtonsville and most of East County are in neither downcounty nor upcounty.
Public financing changes fundraising incentives for politicians. Those who use traditional financing are interested in big checks, whether they come from PACs, businesses, wealthy people or self-funding. Those who use the county’s public financing system (it’s voluntary) are interested in individual contributions from county residents, with the allowable maximum at $250. (The maximum was $150 in the 2018 cycle.) That’s because the county will match individual contributions from residents of up to $150 on a sliding scale, with smaller contributions getting a larger percentage match. Public financing participants can collect individual contributions from non-county residents but those will not get public matching funds. Public financing participants can’t collect contributions from PACs, unions, businesses or other non-individual sources but they can give themselves up to $12,000 in self-funded seed money. (That amount includes money from a spouse.)
And so publicly financed politicians raise money by collecting lots and lots of small checks from county residents and getting public matching funds for them. Those matching funds are capped depending on which office the candidate is seeking and they are only available when certain thresholds of individual contributions are reached. All of this means that it’s really important that publicly financed candidates come into contact with lots of county residents who are going to write checks, even small ones. They will go wherever they think such residents are located. They will hold whatever events are necessary to attract them. They will ask surrogates to round them up on their behalf. And if certain communities don’t contribute as much money and/or don’t fit the politician’s electoral strategy, the politician will spend less time there. From a fundraising perspective, what’s the point of talking to people who either can’t or won’t write checks that can be matched with public funds?
In a previous post, I wrote that downcounty accounted for a disproportionate percentage of voting in the 2018 Democratic primary. That was the case long before 2018 and county politicians understand that reality. It turns out that downcounty residents not only vote more, they contribute more too. That has had a measurable impact in the public financing system.
We will begin analyzing that in Part Two.
Biden’s Billions
By Adam Pagnucco.
President Joe Biden and Democrats in Congress passed a mammoth economic stimulus plan last week. The plan contains hundreds of billions of dollars in aid to states and local governments. How much of that is coming to Maryland?
According to U.S. Senators Ben Cardin and Chris Van Hollen, a LOT.
Cardin and Van Hollen estimate that Maryland and its local jurisdictions will receive a total of nearly $6.4 billion, with the state getting $3.9 billion, the counties getting $1.2 billion and municipalities getting $1.1 billion. The money can be used to respond to or mitigate the COVID-19 health emergency or its negative economic impacts, including assistance to households, small businesses, nonprofits, and aid for tourism, travel, and hospitality; provide essential workers with premium pay; cover revenue loss as a result incurred as a result of the COVID-19 emergency; or to make necessary investments in water, sewer, or broadband infrastructure. The money cannot be used to support any pension fund or offset a tax cut.
The table below shows the estimated distribution of funds by county.

The table below shows the estimated distribution of funds for MoCo and its municipalities.
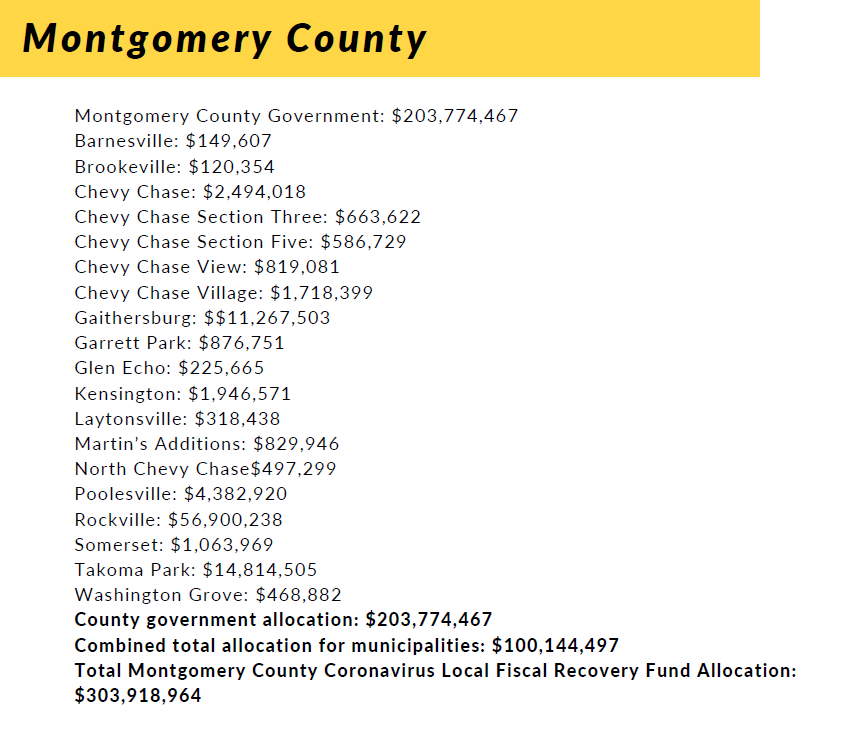
The plan also includes lots of additional money for education, transportation and more.
This doesn’t solve all of MoCo’s budget problems, especially the issues connected to the county’s long-term lack of competitiveness in the region. But it should help the county balance its budget without raiding reserves or retiree health care so long as it practices some spending restraint. One mistake that the county should not make is to use this one-time funding to initiate new indefinite, long-term spending. This federal money, while welcome, is temporary.
The executive’s recommended budget comes out later today.