
By Adam Pagnucco.
Downcounty exerts a disproportionate impact in voting for countywide offices. It also exerts disproportionate influence in public financing. Let’s begin analyzing why that is.
The table below summarizes the types of contributions received by the four candidates for county executive and the 25 candidates for county council at-large who enrolled in public financing in 2018.
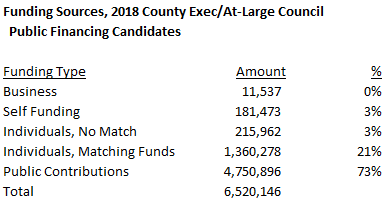
Receipts from businesses primarily relate to refunds, especially deposit refunds. They show up in public financing reports as contributions, but they are not true contributions in that they don’t add net financial value to campaigns. Self-funding of up to $12,000 (including money from spouses) is allowed for publicly financed candidates. Money received in the “individual, no match” category comes from individuals who live outside the county. Under the county’s public financing system, their contributions are not eligible for public matching funds. Money received in the “individual, matching funds” category comes from county residents. Their contributions ARE eligible for public matching funds. Finally, money received in the “public contributions” category are public matching funds. In 2018, 94% of all money received by publicly financed politicians came from individual contributions eligible for matching funds plus the matching funds distributed for them.
Because public matching funds are distributed through a formula tied to eligible individual contributions from county residents, it is the latter that is key to determining overall fundraising for publicly financed politicians. The more individual contributions from county residents, the more public matching funds the politician receives (subject to caps). As seen above, there are no other major sources of money available to candidates in public financing.
Now let’s look at where individual contributions from county residents that are eligible for public matching funds come from. The table below shows their distribution for each zip code with more than 10,000 residents. Again, this includes individual contributions from county residents to executive and council at-large candidates but not district council candidates (since they would skew the geography).
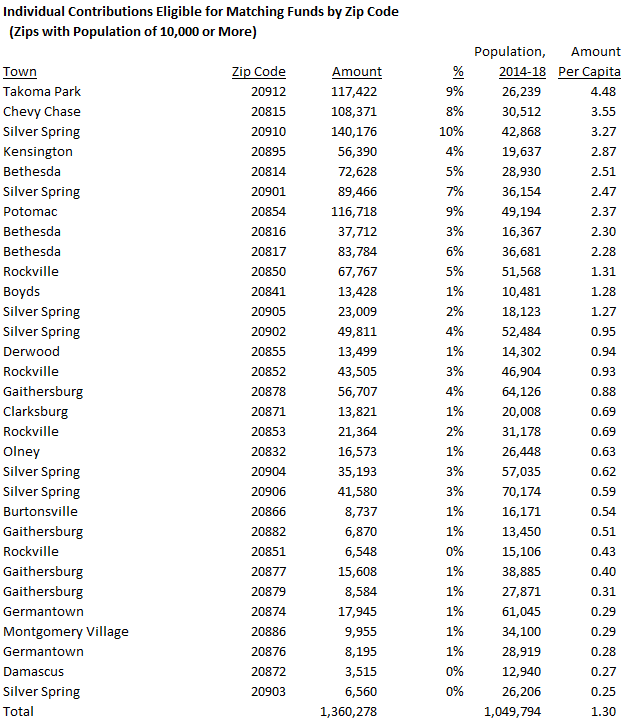
The average eligible individual contribution per capita was $1.30. In terms of per capita contributions, the top six zip codes, as well as eight of the top nine, were in downcounty. Takoma Park led the way at $4.48 per capita, more than three times the county average. (It’s probably not a coincidence that Marc Elrich, the top fundraiser in public financing and the winning candidate for county executive, is a long-time resident and former city council member in Takoma Park.) Six of the bottom seven zip codes in per capita contributions were in upcounty. The exception was zip code 20903, which has one of the lowest average household incomes in MoCo.
The table below summarizes individual contributions from county residents that are eligible for public matching funds by region.
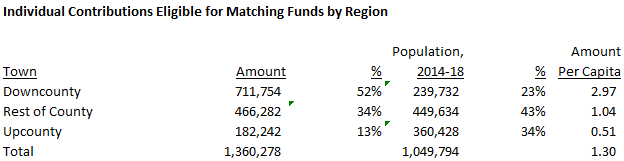
According to the U.S. Census Bureau, downcounty accounts for less than a quarter of the county’s population. However, downcounty donated 52% of individual contributions eligible for matching funds in 2018. Upcounty accounts for about a third of the county’s population but donated less than one-seventh of individual contributions eligible for matching funds in 2018. In per capita terms, downcounty residents contributed $2.97 each to publicly financed candidates, almost six times the per capita amount contributed by upcounty residents (51 cents).
It’s really no contest. Downcounty dominated public financing in 2018. Upcounty lagged badly.
In Part Three, we will discuss the fundraising geography of individual candidates.
