
By Adam Pagnucco.
There were huge differences in public financing participation by geography in 2018. In some areas, residents donated significant amounts of money to publicly-financed candidates which were enhanced by matching funds paid out by the county. In other areas, residents contributed very little to publicly-financed candidates. These areas match existing patterns of political influence that were greatly amplified through distributions of matching public funds.
Let’s start with downcounty, hereby defined as the Democratic Crescent that sent Jamie Raskin to Congress. Downcounty is diverse in terms of demographics and economics but it is characterized by moderate to high turnout rates in Democratic primaries, high degrees of civic organization and lots of progressive activism.
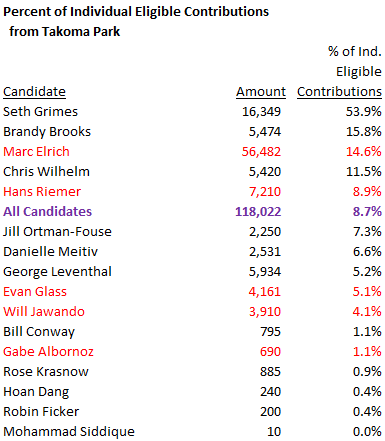
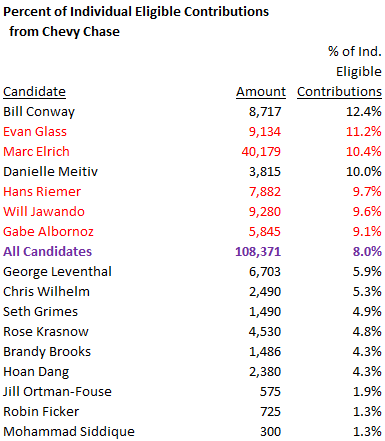
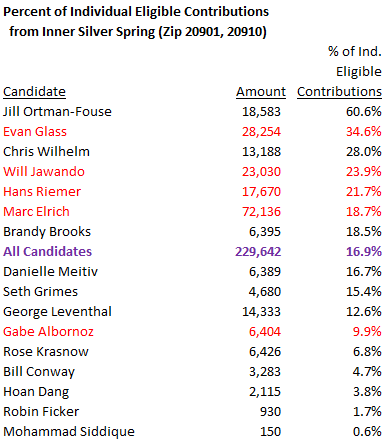
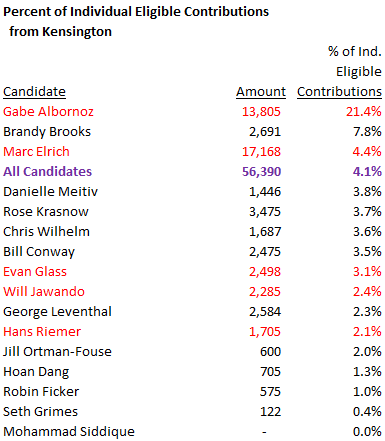
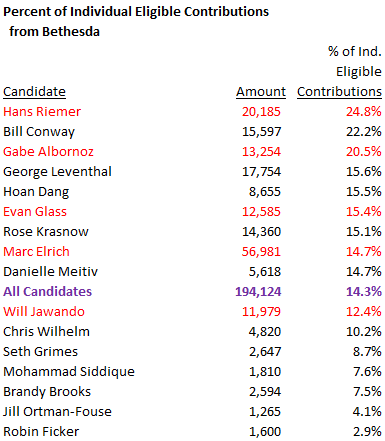
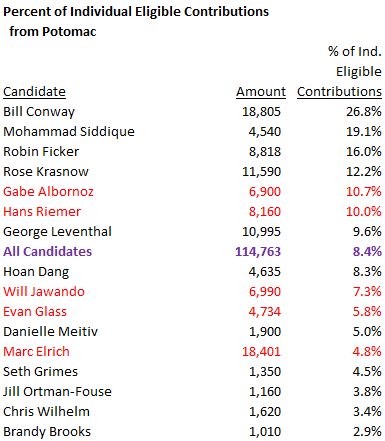
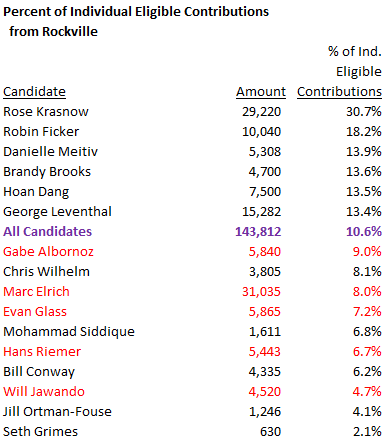
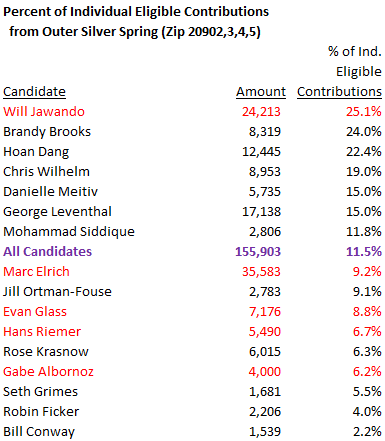
The downcounty areas shown below have two things in common. First, all of them exceeded per capita averages of individual contributions to publicly-financed candidates. Second, the winning candidates (Marc Elrich for executive and Hans Riemer, Will Jawando, Evan Glass and Gabe Albornoz for council at-large) tended to receive higher percentages of their campaign funding from these areas than most of the losing candidates. That makes sense – under public financing, fundraising and voting tend to go together. The tables below show amounts and percentages of fundraising by downcounty area for executive and council at-large candidates who qualified for matching funds. Winning candidates are shown in red.
All five downcounty areas participated a lot in public financing. Below are three populated areas located neither in downcounty nor in upcounty that had neither really high nor really low participation rates in public financing.
In Part Five, we shall see which areas disproportionately did not participate in public financing.
