Part Four illustrated the significant flows of political contributions from downcounty to candidates in public financing. Today, we shall see which communities lagged behind.
Gaithersburg
Gaithersburg combines an incorporated area with a municipal government and an unincorporated area administered directly by the county. Zip codes in the incorporated and unincorporated areas together account for roughly 14% of the county’s population, and along with Germantown, comprise one of the two biggest population centers in upcounty.
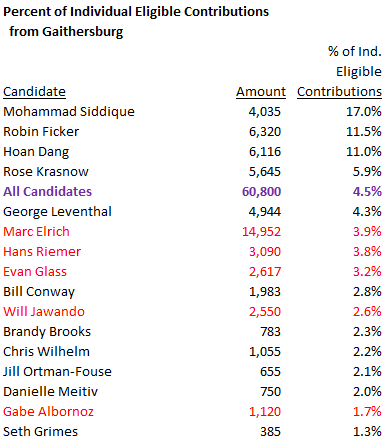
The table below shows amounts and percentages of fundraising from Gaithersburg by executive and council at-large candidates who qualified for matching funds. Winning candidates are shown in red.
Despite its size, Gaithersburg accounted for less than 5% of individual contributions eligible for matching funds. Gaithersburg’s population is slightly larger than the combined populations of Bethesda, Chevy Chase and Kensington. Residents of those areas gave $358,885 to publicly-financed candidates while Gaithersburg residents gave $60,800.
Germantown
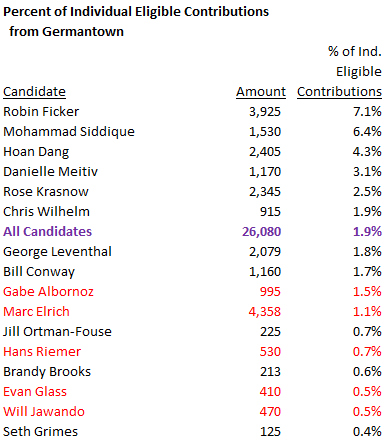
Germantown’s zip codes account for roughly 9% of the county’s population but its residents donated less than 2% of the in-county individual contributions received by candidates in public financing. Germantown’s population is larger than Bethesda’s. Nevertheless, Bethesda residents contributed $194,124 to publicly financed candidates while Germantown residents gave $26,080.
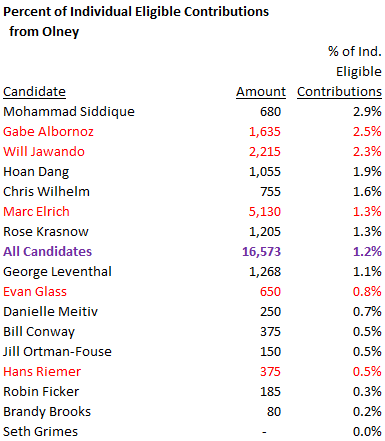
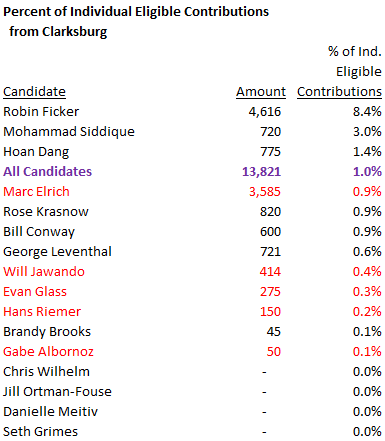
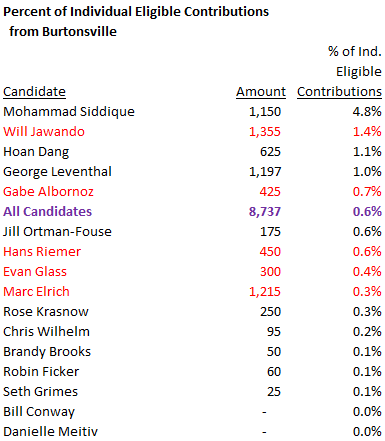
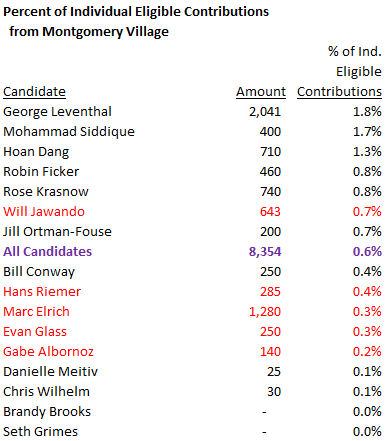
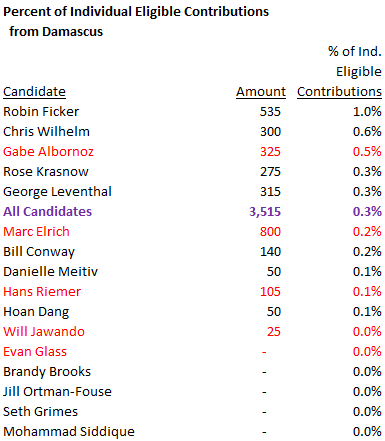
The tables below shows areas with significant population but lower than average participation rates in public financing. Note their concentration in upcounty and east county.
Public financing is here to stay and many – perhaps even most – county politicians will use it. Politicians go where the money is and they tend to be particularly attentive to constituencies who contribute. Right now, this system favors downcounty, where concentrations of contributors and high-frequency voters tend to be located. If other parts of the county want to get equal attention, they are going to have to run some candidates and get behind them with money and votes.
There were huge differences in public financing participation by geography in 2018. In some areas, residents donated significant amounts of money to publicly-financed candidates which were enhanced by matching funds paid out by the county. In other areas, residents contributed very little to publicly-financed candidates. These areas match existing patterns of political influence that were greatly amplified through distributions of matching public funds.
Let’s start with downcounty, hereby defined as the Democratic Crescent that sent Jamie Raskin to Congress. Downcounty is diverse in terms of demographics and economics but it is characterized by moderate to high turnout rates in Democratic primaries, high degrees of civic organization and lots of progressive activism.
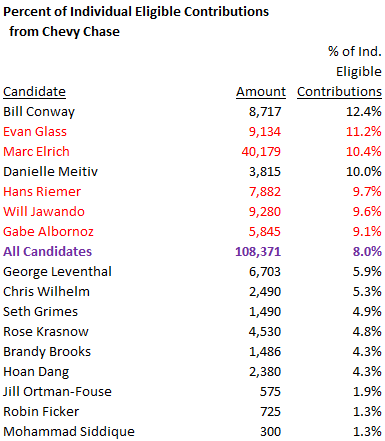
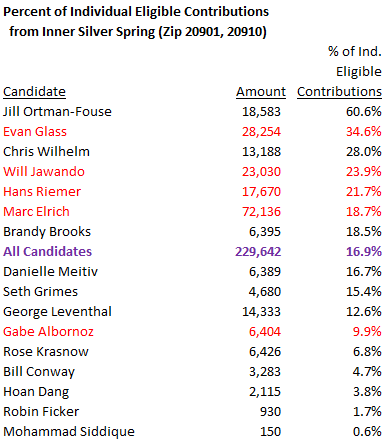
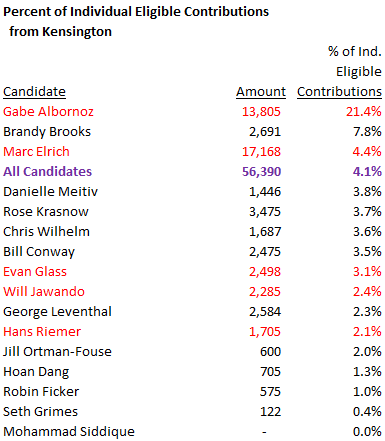
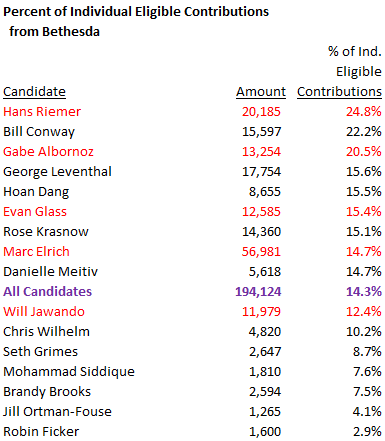
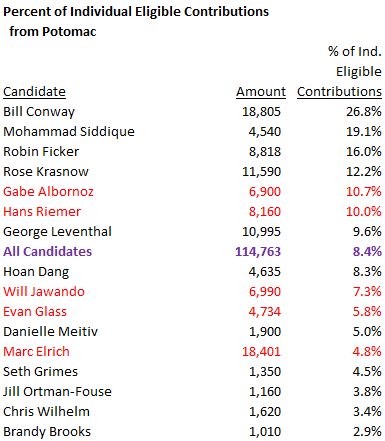
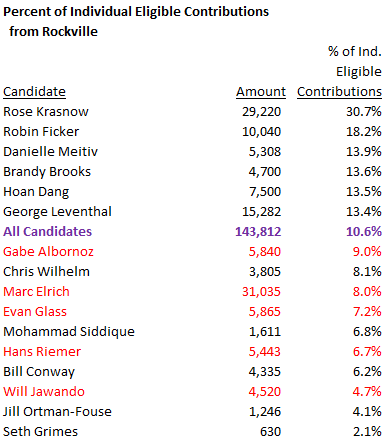
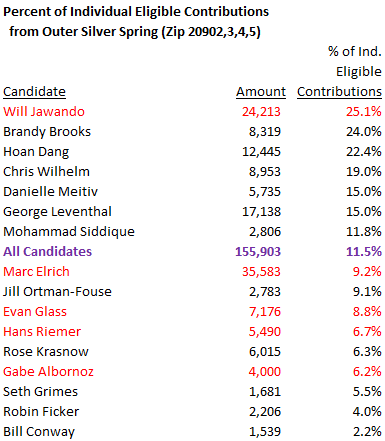
The downcounty areas shown below have two things in common. First, all of them exceeded per capita averages of individual contributions to publicly-financed candidates. Second, the winning candidates (Marc Elrich for executive and Hans Riemer, Will Jawando, Evan Glass and Gabe Albornoz for council at-large) tended to receive higher percentages of their campaign funding from these areas than most of the losing candidates. That makes sense – under public financing, fundraising and voting tend to go together. The tables below show amounts and percentages of fundraising by downcounty area for executive and council at-large candidates who qualified for matching funds. Winning candidates are shown in red.
All five downcounty areas participated a lot in public financing. Below are three populated areas located neither in downcounty nor in upcounty that had neither really high nor really low participation rates in public financing.
In Part Five, we shall see which areas disproportionately did not participate in public financing.
In Part Two, we learned that downcounty accounts for less than one-quarter of the county’s population but comprised 52% of individual contributions eligible for matching funds to countywide candidates in 2018. Let’s look at the contribution geography of the candidates who won countywide offices and used public financing that year.
Marc Elrich
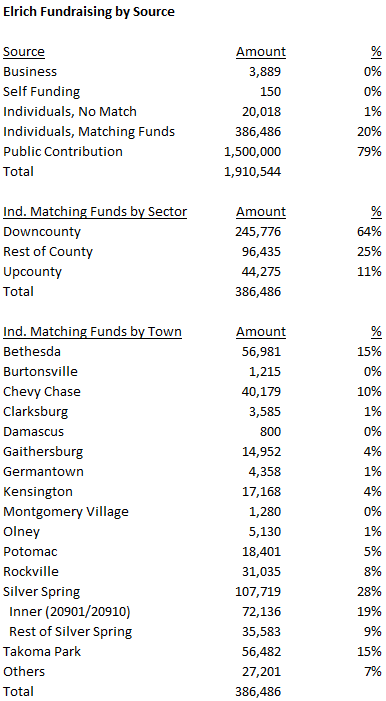
Elrich was a city council member in Takoma Park from 1987 through 2006 and an at-large member of the county council from 2006 through 2018. He was elected county executive for the first time two years ago. He raised more money in public financing than anyone else because of two factors: 1. county executive candidates have more generous matching formulas than council candidates, and 2. he had a competitive general election that necessitated more fundraising. In both the primary and the general, Elrich hit the matching funds cap of $750,000 for each election.
Elrich received $386,486 in individual contributions from county residents. Subject to the $750,000 caps, these contributions were eligible for public matching funds. Of the $386,486 in eligible contributions, 64% came from downcounty, higher than the all-candidate average of 52%. Elrich’s biggest sources of fundraising were inner Silver Spring (19%), Bethesda (15%) and Takoma Park (15%). Only 11% of Elrich’s eligible individual contributions came from upcounty.
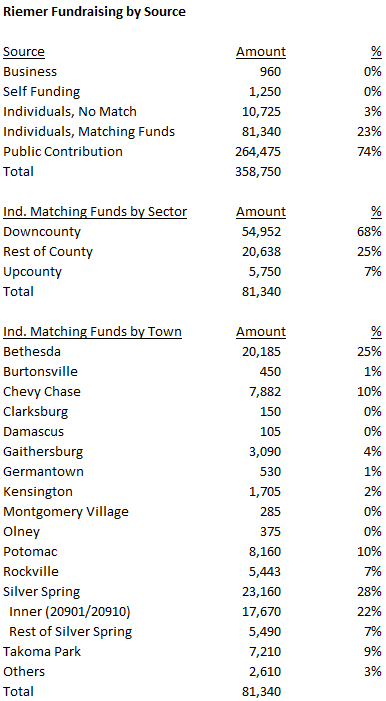
Hans Riemer
Riemer has been an at-large council member since 2010. He was the only at-large incumbent who ran for reelection in 2018, a crucial advantage that helped him finish first in the primary. He is prevented by term limits from running for reelection to his current seat but he is free to run for other offices.
Riemer received $81,340 in individual contributions from county residents. Of these, 68% came from downcounty, higher than the all-candidate average of 52%. Riemer’s biggest sources of fundraising were Bethesda (25%), inner Silver Spring (22%) and Chevy Chase and Potomac (10% each). Only 7% of Riemer’s eligible individual contributions came from upcounty.
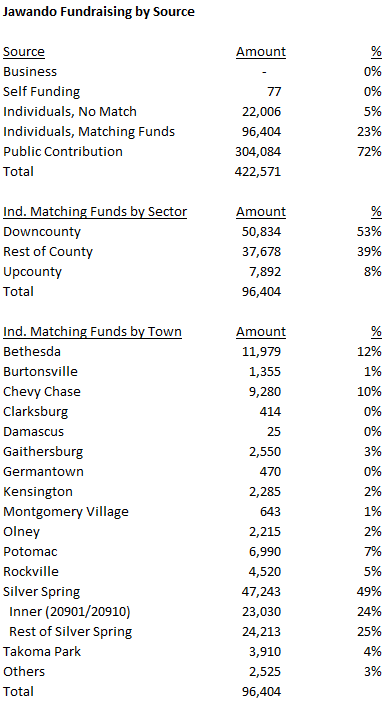
Will Jawando
Jawando ran for Delegate in District 20 in 2014 and he ran for Congress in District 8 in 2016. He finished second in the 2018 council at-large primary. Jawando raised more money than any other council candidate in public financing but has nonetheless chosen to use traditional financing in this cycle.
Jawando received $96,404 in individual contributions from county residents. Of these, 53% came from downcounty, about the same as the all-candidate average of 52%. Jawando’s biggest sources of fundraising were outer Silver Spring (25%), inner Silver Spring (24%) and Bethesda (12%). Only 8% of Jawando’s eligible individual contributions came from upcounty.
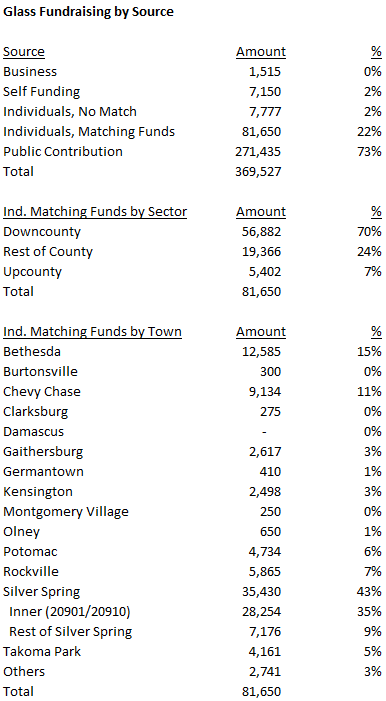
Evan Glass
Glass was a long-time civic leader who ran for the District 5 council seat in 2014 and barely lost to then-District 20 Delegate Tom Hucker. He finished third in the 2018 council at-large primary.
Glass received $81,650 in individual contributions from county residents. Of these, 70% came from downcounty, higher than the all-candidate average of 52%. Glass’s biggest sources of fundraising were inner Silver Spring (35%), Bethesda (15%) and Chevy Chase (11%). Only 7% of Glass’s eligible individual contributions came from upcounty.
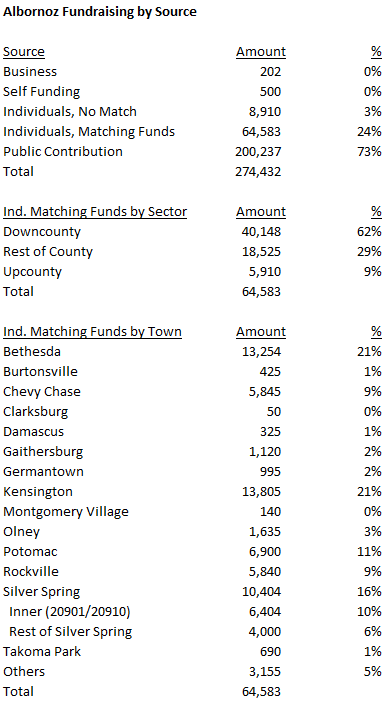
Gabe Albornoz
Albornoz was the county’s director of recreation for 12 years and is a former chair of the county’s Democratic Party. He finished fourth in the 2018 council at-large primary.
Albornoz received $64,583 in individual contributions from county residents. Of these, 62% came from downcounty, higher than the all-candidate average of 52%. Albornoz’s biggest sources of fundraising were Kensington (21%), Bethesda (21%) and Potomac (11%). Only 9% of Albornoz’s eligible individual contributions came from upcounty.
Brandy Brooks
Brooks was a new resident in the 2018 cycle, having registered to vote in Maryland in April 2016. She picked up a number of important endorsements and ran a strong race, ultimately finishing seventh in the 2018 council at-large primary. Even though Brooks didn’t win, she is in this list because she is running again and is off to a fast head start.
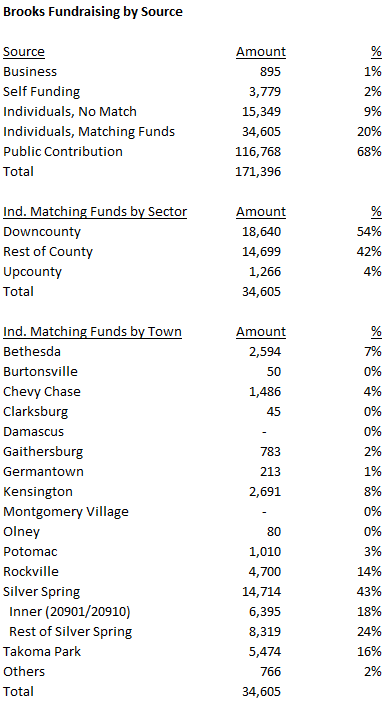
Brooks received $34,605 in individual contributions from county residents. Of these, 54% came from downcounty and 43% came from Silver Spring. Despite receiving just 4% of her contributions from upcounty, Brooks finished fourth there with a second-place showing in Montgomery Village.
The five winning candidates for countywide office, all of whom used public financing, have two things in common. First, all of them received a majority of their in-county individual contributions from downcounty, which accounts for less than a quarter of MoCo’s population. Second, none of them received more than 11% of their in-county individual contributions from upcounty despite the fact that roughly a third of MoCo residents live in upcounty.
This is as good a demonstration of downcounty’s political influence as any.
In Part Four, we will begin looking at who led in fundraising in each of the county’s major population centers.
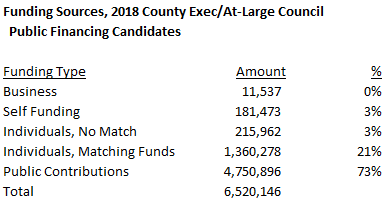
The table below summarizes the types of contributions received by the four candidates for county executive and the 25 candidates for county council at-large who enrolled in public financing in 2018.
Receipts from businesses primarily relate to refunds, especially deposit refunds. They show up in public financing reports as contributions, but they are not true contributions in that they don’t add net financial value to campaigns. Self-funding of up to $12,000 (including money from spouses) is allowed for publicly financed candidates. Money received in the “individual, no match” category comes from individuals who live outside the county. Under the county’s public financing system, their contributions are not eligible for public matching funds. Money received in the “individual, matching funds” category comes from county residents. Their contributions ARE eligible for public matching funds. Finally, money received in the “public contributions” category are public matching funds. In 2018, 94% of all money received by publicly financed politicians came from individual contributions eligible for matching funds plus the matching funds distributed for them.
Because public matching funds are distributed through a formula tied to eligible individual contributions from county residents, it is the latter that is key to determining overall fundraising for publicly financed politicians. The more individual contributions from county residents, the more public matching funds the politician receives (subject to caps). As seen above, there are no other major sources of money available to candidates in public financing.
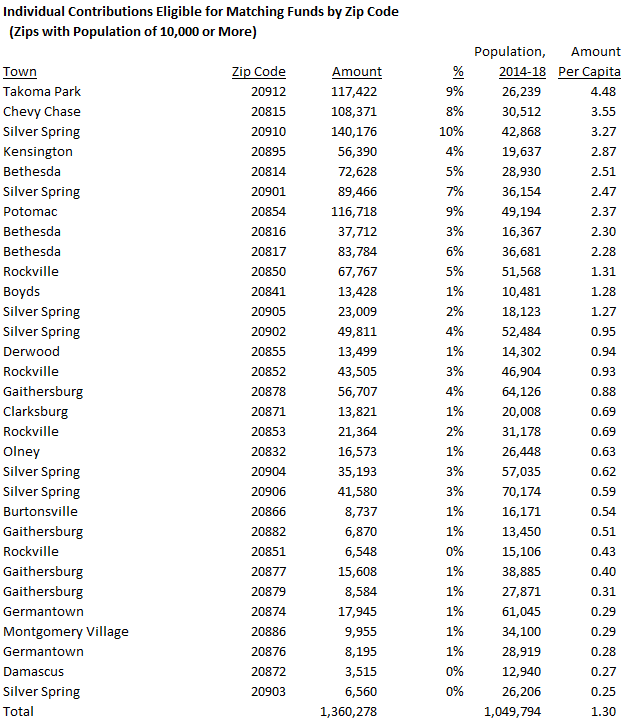
Now let’s look at where individual contributions from county residents that are eligible for public matching funds come from. The table below shows their distribution for each zip code with more than 10,000 residents. Again, this includes individual contributions from county residents to executive and council at-large candidates but not district council candidates (since they would skew the geography).
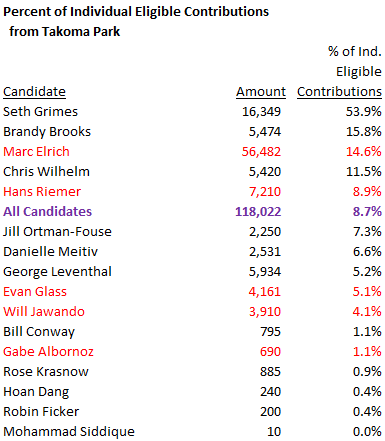
The average eligible individual contribution per capita was $1.30. In terms of per capita contributions, the top six zip codes, as well as eight of the top nine, were in downcounty. Takoma Park led the way at $4.48 per capita, more than three times the county average. (It’s probably not a coincidence that Marc Elrich, the top fundraiser in public financing and the winning candidate for county executive, is a long-time resident and former city council member in Takoma Park.) Six of the bottom seven zip codes in per capita contributions were in upcounty. The exception was zip code 20903, which has one of the lowest average household incomes in MoCo.
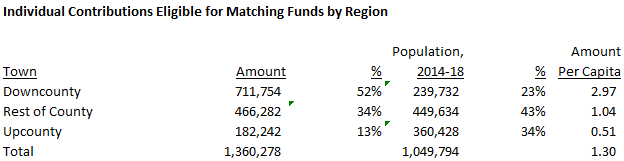
The table below summarizes individual contributions from county residents that are eligible for public matching funds by region.
According to the U.S. Census Bureau, downcounty accounts for less than a quarter of the county’s population. However, downcounty donated 52% of individual contributions eligible for matching funds in 2018. Upcounty accounts for about a third of the county’s population but donated less than one-seventh of individual contributions eligible for matching funds in 2018. In per capita terms, downcounty residents contributed $2.97 each to publicly financed candidates, almost six times the per capita amount contributed by upcounty residents (51 cents).
It’s really no contest. Downcounty dominated public financing in 2018. Upcounty lagged badly.
In Part Three, we will discuss the fundraising geography of individual candidates.
When Montgomery County passed public financing more than six years ago, many predictions were made. Public financing was supposed to empower small donors. (It did.) It was supposed to draw in more candidates for office. (It did.) It was supposed to reduce the influence of “special interests.” (That’s debatable.) But one of its biggest impacts was something no one predicted because it wasn’t on anyone’s radar when it was passed:
Public financing has amplified the political influence of downcounty.
In this series, we are going to investigate the geography of political contributions made in the county’s public financing system. That’s important because just as politicians pay special attention to the sources of their votes, they certainly pay special attention to the sources of their campaign contributions. Knowing where the money comes from greatly aids the understanding of our political system and public financing is no exception.
First, let’s discuss methodology. This series looks at public financing contributions to 2018 candidates for county executive and county council at-large. It excludes candidates for district council seats because their contributions naturally skew towards their districts. Of particular interest are individual contributions that are eligible for public matching funds. (We’ll explain more about this below.)
In terms of geography, we will look at towns, zip codes and two regions: downcounty and upcounty. Downcounty is defined as the “Democratic Crescent,” a term I coined that includes Takoma Park, Silver Spring (inside the Beltway), Chevy Chase, Kensington, Bethesda, Glen Echo and Cabin John. Because there are thousands of individual contributions, I am using zip codes 20901 and 20910 as proxies for Silver Spring inside the Beltway. Upcounty is defined as Ashton, Barnesville, Boyds, Beallsville, Brookeville, Clarksburg, Damascus, Dickerson, Gaithersburg, Germantown, Laytonsville, Montgomery Village, Olney, Poolesville, Sandy Spring, Spencerville and Washington Grove. Lots of communities, including but not limited to Rockville, Potomac, Wheaton, Glenmont, Burtonsville and most of East County are in neither downcounty nor upcounty.
Public financing changes fundraising incentives for politicians. Those who use traditional financing are interested in big checks, whether they come from PACs, businesses, wealthy people or self-funding. Those who use the county’s public financing system (it’s voluntary) are interested in individual contributions from county residents, with the allowable maximum at $250. (The maximum was $150 in the 2018 cycle.) That’s because the county will match individual contributions from residents of up to $150 on a sliding scale, with smaller contributions getting a larger percentage match. Public financing participants can collect individual contributions from non-county residents but those will not get public matching funds. Public financing participants can’t collect contributions from PACs, unions, businesses or other non-individual sources but they can give themselves up to $12,000 in self-funded seed money. (That amount includes money from a spouse.)
And so publicly financed politicians raise money by collecting lots and lots of small checks from county residents and getting public matching funds for them. Those matching funds are capped depending on which office the candidate is seeking and they are only available when certain thresholds of individual contributions are reached. All of this means that it’s really important that publicly financed candidates come into contact with lots of county residents who are going to write checks, even small ones. They will go wherever they think such residents are located. They will hold whatever events are necessary to attract them. They will ask surrogates to round them up on their behalf. And if certain communities don’t contribute as much money and/or don’t fit the politician’s electoral strategy, the politician will spend less time there. From a fundraising perspective, what’s the point of talking to people who either can’t or won’t write checks that can be matched with public funds?
In January 2014, District 1 County Council Member Roger Berliner posted a cash balance of $52,369 in his campaign finance report. Over the prior year, he had raised just $200. Berliner was a battle-tested politician as he had defeated an incumbent to get elected in 2006 and then beat a capable challenger in 2010. But he had clearly taken 2013 off, at least from a political perspective.
That caught the attention of former At-Large Council Member Duchy Trachtenberg, who had been ousted in 2010 and was looking for a way to get back into politics. Trachtenberg filed to run against Berliner hours before the filing deadline and was sitting on a cash balance of $122,575 from the last election. She looked like a threat as she was a former incumbent, had money and brought union support and some business support into the race.
Berliner went into overdrive, raising money hand over fist and locking down his district. He wound up thrashing Trachtenberg by 57 points. But if he had shown a large cash balance, Trachtenberg might not have run against him in the first place.
Berliner’s successor, Council Member Andrew “Real Deal” Friedson, is no doubt aware of this history.
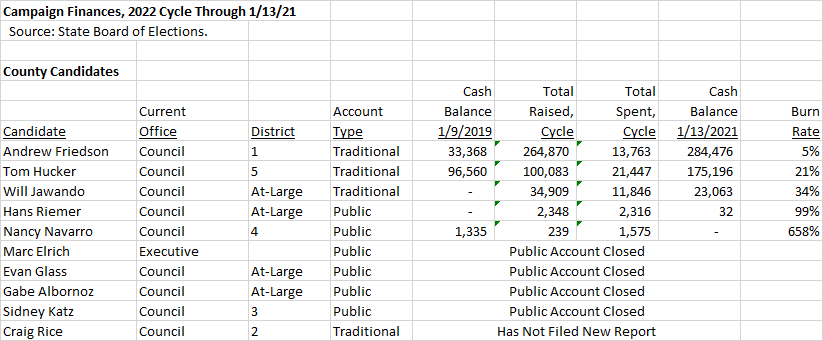
The table below shows campaign finance data for the incumbent county executive and county council members. My presentation differs from other sources in two ways. First, I show money raised and spent for the entire cycle, not just the last year. Second, I calculate burn rate, which is the percentage of money raised that has already been spent. Burn rate is important because candidates need to keep it low in the beginning to save up for large expenditures like mail at the end.
Friedson’s numbers are the obvious headline. He raised $264,870 for the cycle and has a cash balance of $284,476. His burn rate was a rock bottom 5%, meaning he spent very little compared to what he raised. We’ll get into just how astounding Friedson’s cash balance is below.
District 5 County Council Member Tom Hucker also did well, raising $100,083 and finishing with a cash balance of $175,196. Hucker was aided by the facts that he had marginal opposition in the last election and he has been raising money for a potential run for comptroller. If he runs for his current seat, his cash balance is excellent. But in a race for comptroller, he trails actual and potential candidates Delegate Brooke Lierman ($588,292 on hand), Senator Brian Feldman ($346,320), Bowie Mayor Tim Adams ($253,130) and Senator Jim Rosapepe ($207,181).
At-Large Council Member Will Jawando was the top fundraiser among county council candidates in public financing last time. But after entering traditional financing, he reported a cash balance of just $23,063. Jawando is a talented candidate and he has time to fix this, but at this moment, he doesn’t look as strong as he should.
Most of the other incumbents were in public financing last time and either have no money or have closed and not reopened public financing accounts. They don’t need to have an active public account right now as they are not eligible for county matching funds until a year before the next primary (which will be held on June 28, 2022). But they should open public accounts soon.
At-Large Council Member Hans Riemer, District 2 Council Member Craig Rice and District 4 Council Member Nancy Navarro are term limited. They can’t run for council in the next election but they could run for other offices.
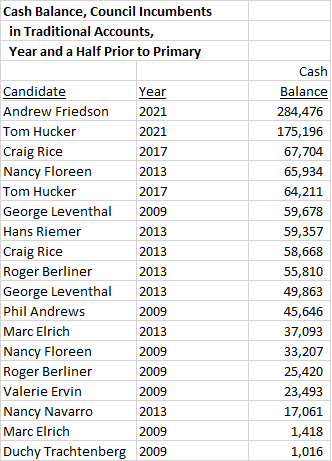
Let’s return to Friedson’s huge cash balance, which was posted a year and a half before the next primary. The table below shows cash balances reported by council incumbents in traditional financing a year and a half before the next primary over the last four cycles (2010, 2014, 2018 and 2022). There are a lot of good fundraisers in here, especially the at-large incumbents who often raised more than $250,000 for their reelections. Friedson’s number smokes them all and so does Hucker’s.
If Hucker runs for reelection to his current seat, it’s hard to see him having a problem. He has represented the core of his district since he was first elected as a District 20 Delegate in 2006 and his political roots there go back much farther than that. The recipe for running in that area is to go as far left as possible and it’s difficult to get to the left of Hucker.
Friedson is a different story. Some on the left dislike his alliance with the business community (which is reflected in his fundraising) and his fiscal conservatism (at least in highly relative MoCo terms). They note that he won his first primary with 28% of the vote in an 8-candidate race. Rumors of a primary challenge have circulated for months. Friedson’s opponents should be mindful of the district’s 30-year history of electing Republicans and Democrats with moderate tendencies as well as Friedson’s status as a hometown boy.
In any event, Friedson is sending a message to critics and potential opponents with his huge war chest. It goes something like this.
You can’t outraise me. You can’t outwork me. I am going to dominate every meaningful measure of political power in District 1. Save your time and your money and focus on other races because I am going to win.
That’s the message from the Real Deal. Will it be heard?
The six committees formed to advocate for and against MoCo’s ballot questions have filed their final campaign finance reports before the general election, covering the period through October 18. Let’s see where the money is coming from.
Question B: Would remove the ability of the county council to break the current charter limit on property taxes, thereby capping property tax revenue growth at the rate of inflation. Authored by Robin Ficker.
Question C: Would add 2 district seats to the county council, thereby establishing 7 district seats and 4 at-large seats. Authored by Council Member Evan Glass. See MoCo Could Use More County Council Districts.
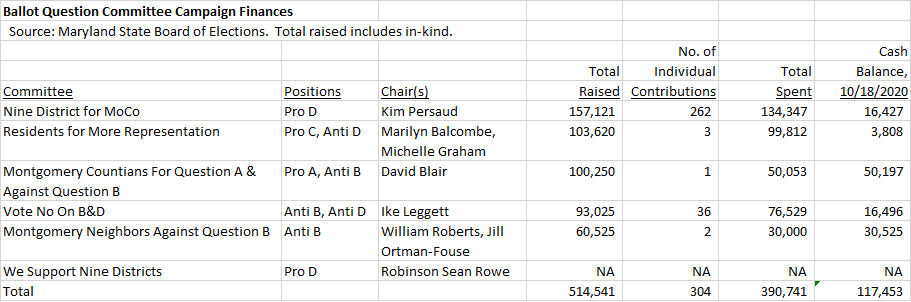
Here is a summary of finances for the committees for the entire cycle through October 18.
To understand why these flows of money are occurring, it’s useful to recall the genesis of these questions. This year’s ballot question fight was joined when two questions were placed on the ballot by petition: Robin Ficker’s anti-tax Question B and Nine Districts for MoCo’s Question D, which would eliminate council at-large seats and remake the council into 9 district seats. In response to those ballot questions, the county council put two of its own questions on the ballot to compete with them: Question A (a different tax limitation measure) and Question C (which would keep the at-large seats and add two district seats). It is believed by some that if two directly conflicting ballot questions pass, they will both get thrown out, though that is not 100% certain.
Once it became clear that both Ficker’s anti-tax question and the nine districts question were going to appear on the ballot, no fewer than four new ballot issue committees were created to stop one or both of them and/or to promote the council’s alternatives. In short order, many of the county’s power players took sides in an uncommon off-year ballot question war. The players’ positions are at least as interesting as the committees’ activities themselves.
Nine Districts for MoCo, the oldest of the committees, has by far the most individual contributors but 82% of its cash funding has come from the real estate industry. In its most recent report, MoCo GOP Central Committee Member Ann Hingston made 6 more in-kind contributions totaling $993, thereby providing more evidence of the links between Nine Districts and the county Republican Party. Nine Districts’ fundraising pace has slowed as they have collected just $154 since October 4.
The competing committees have rapidly closed the gap. Three groups have paid for mail: former County Executive Ike Leggett’s group opposing Questions B and D, former executive candidate David Blair’s group supporting Question A and opposing Question B and Residents for More Representation, a group supporting Question C and opposing Question D. These groups are also paying for websites and online advertising. But they got off to a late start while Nine Districts has been campaigning for more than a year.
Below are all the major players who have contributed at least $10,000 to one or a combination of these ballot issue committees.
David Blair – $165,000 Supports Questions A and C, opposes Questions B and D Businessman and former executive candidate David Blair is the number one spender on ballot questions. He has contributed $65,000 to Legget’s group opposing Questions B and D, $50,000 to his own group supporting Question A and opposing Question B, and $50,000 to Residents for More Representation, which supports Question C and opposes Question D. Blair’s positions mirror the positions taken by the county Democratic Party. (Disclosure: I have done work for Blair’s non-profit but I am not involved in his ballot question activities.)
Charlie Nulsen – $123,500 Supports Questions A, C and D, opposes Question B Nulsen is the president of Washington Property Company. On June 4, he contributed $50,000 to Nine Districts to help get Question D on the ballot. On October 13, he contributed $23,500 to Residents for More Representation to defeat Question D. Nulsen could have saved more than $70,000 and achieved the same outcome by simply doing nothing. He also contributed $50,000 to Blair’s group supporting Question A and opposing Question B.
Monte Gingery – $40,000 Supports Question D The head of Gingery Development Group has made three contributions totaling $40,000 to Nine Districts.
Willco – $40,000 Supports Questions C and D On August 5, this Potomac developer gave an in-kind contribution of $15,000 to Nine Districts which was used to pay Rowland Strategies (their campaign firm). On October 9, Willco gave $25,000 to Residents for More Representation, which is seeking to pass Question C and defeat Nine Districts. Folks, you can’t make it up.
MCGEO – $30,000 Supports Question A, Opposes Question B, Gave Contribution to Question D The Municipal and County Government Employees Organization (MCGEO) has made a $20,000 contribution to Montgomery Neighbors Against Question B and a $10,000 in-kind contribution to Nine Districts. MCGEO President Gino Renne is the treasurer of Empower PAC, which gave another $5,000 to Montgomery Neighbors Against Question B.
MCEA – $20,000 Opposes Question B The Montgomery County Education Association (MCEA) has contributed $20,000 to Montgomery Neighbors Against Question B.
UFCW Local 400 – $10,000 Opposes Question B This grocery store union which shares a parent union with MCGEO gave $10,000 to Montgomery Neighbors Against Question B.
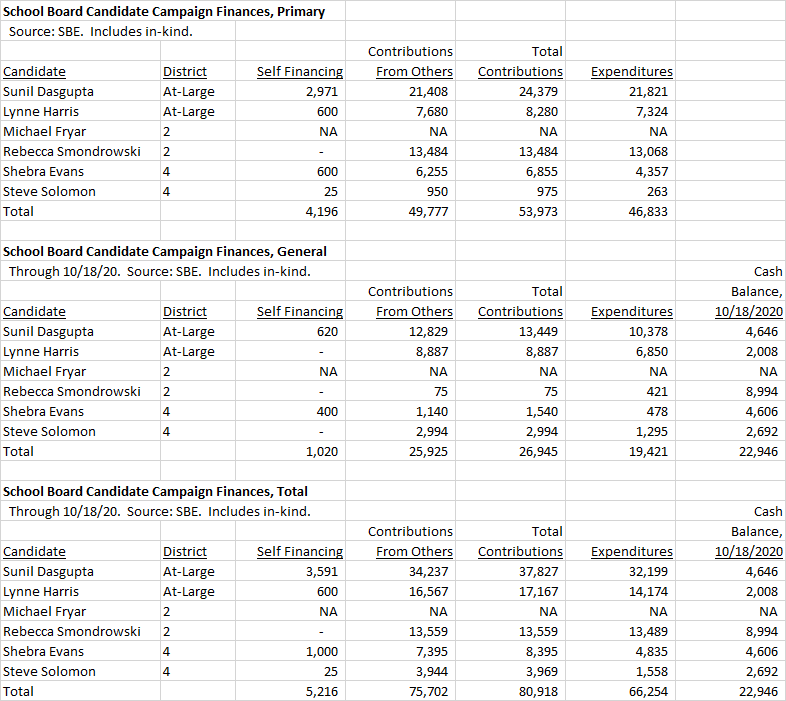
The school board candidates’ last campaign finance reports prior to the general election were submitted to the state on Friday. The table below shows money raised and spent for both the primary and the general.
There are a number of things I could point to here, such as Sunil Dasgupta’s financial edge over Lynne Harris (although that has declined in the general) and the fact that incumbents Rebecca Smondrowski and Shebra Evans don’t seem to be taking their challengers very seriously. (Smondrowski’s opponent, Michael Fryar, has raised no money but was still endorsed by the Washington Post. MCEA has not endorsed in that race.)
But the big story is what I wrote the last time I looked at these reports: these candidates are basically all broke. And that is particularly striking given the fact that at least a half-million people are probably going to vote in the general election this year. It’s impossible to reach that many people on a $20,000 budget (or less).
To MoCo’s state delegation: school board candidates desperately need public financing. Please introduce legislation enabling that to happen.
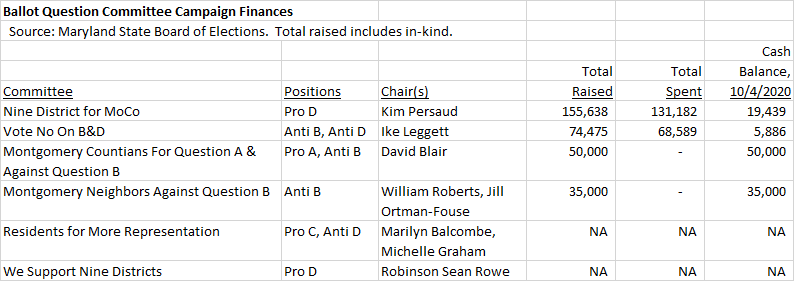
The six committees formed to advocate for and against MoCo’s ballot questions have filed campaign finance reports through October 4. Let’s see who is paying for all of this – so far.
Question B: Would remove the ability of the county council to break the current charter limit on property taxes, thereby capping property tax revenue growth at the rate of inflation. Authored by Robin Ficker.
Question C: Would add 2 district seats to the county council, thereby establishing 7 district seats and 4 at-large seats. Authored by Council Member Evan Glass. See MoCo Could Use More County Council Districts.
Here is a summary of committee finances for the entire cycle.
Nine District for MoCo, by far the oldest committee, has raised and spent the most money. It has had far more individual contributions (252) than Ike Leggett’s Vote No on B and D (30) with no other committee reporting any. Real estate interests have accounted for 83% of Nine District’s cash contributions. Interestingly, while Washington Property Company president Charlie Nulsen and the three county employee unions were major Nine District contributors in prior reports, they have not contributed any more since July. Nine District has collected contributions from leaders of the county’s Republican Party, which has raised money for the group on its website. The group has spent money on fees for Baltimore consultant Rowland Strategies, legal fees, robocalls and advertising (especially on Facebook).
Vote No on B & D, Leggett’s committee, spent $9,610 on graphic design for printing and campaign materials and $58,437 on direct mailing. So far, this is the only expenditure by any committee on mail. (Where’s my mailer, Ike?) Two other committees have collected money but not spent it and two more have collected less than $1,000.
Here are the biggest contributors to these committees and their positions on the ballot questions.
David Blair – $100,000 Supports Question A, Opposes Questions B and D The former county executive candidate has given $50,000 each to Leggett’s group opposing Questions B and D and his own group supporting Question A and opposing Question B.
Charlie Nulsen – $50,000 Supports Question D The president of Washington Property Company made one $50,000 contribution to Nine District for MoCo on 6/4/20. This was a critical boost for the group as it was in the home stretch of gathering signatures to appear on the ballot.
Monte Gingery – $40,000 Supports Question D The head of Gingery Development Group has made three contributions totaling $40,000 to Nine District for MoCo.
MCGEO – $30,000 Opposes Question B, Supports Question D The largest county government employee union gave $20,000 to Montgomery Neighbors Against Question B and made a $10,000 in-kind contribution to Nine District for MoCo. MCGEO President Gino Renne is the treasurer of Empower PAC, which gave another $5,000 to Montgomery Neighbors Against Question B.
Willco – $15,000 Supports Question D The Potomac developer gave an in-kind contribution of $15,000 to Nine District for MoCo which was used to pay Rowland Strategies.
UFCW Local 400 – $10,000 Opposes Question B This grocery store union which shares a parent union with MCGEO gave $10,000 to Montgomery Neighbors Against Question B.
As MoCo faces a crippling financial shortfall projected at $190 million this year and a billion dollars over the next six years, the county council will be considering increased spending in legislation tomorrow – on political campaigns. The issue at hand is a change in public financing matching formulas that would send more taxpayer dollars into politicians’ campaign funds.
As currently written, the county’s public campaign finance law sends matching funds to participating campaigns for individual contributions made by county residents up to $150. The current formulas appear below.
County Executive candidate
First $50 of individual contribution: matched by 6 public dollars for each dollar collected from a resident. Second $50 of individual contribution: matched by 4 public dollars for each dollar collected from a resident. Third $50 of individual contribution: matched by 2 public dollars for each dollar collected from a resident.
County Council candidate
First $50 of individual contribution: matched by 4 public dollars for each dollar collected from a resident. Second $50 of individual contribution: matched by 3 public dollars for each dollar collected from a resident. Third $50 of individual contribution: matched by 2 public dollars for each dollar collected from a resident.
In the current system, individual contributions are capped at $150 so no matching funds are made available for contributions greater than that amount. Individuals from outside the county may contribute up to $150 each but such donations are not eligible for matching funds. Contributions from entities other than individuals (like businesses and PACs) are prohibited for candidates in public financing. Self-funding of up to $12,000 from a candidate and spouse combined is permitted. Future contribution limits will be updated in future election cycles for inflation.
Bill 31-20, a package of changes to the public financing law, is on the council’s agenda for action tomorrow morning. For the most part, the bill makes a series of benign tweaks to the law. But it does one thing that increases the cost of public financing: it raises eligible individual contributions from $150 to $250 and creates a dollar-for-dollar public match to the hundred dollar increase. So for a candidate accepting a maximum individual contribution, the matching funds formula would be:
County Executive candidate
Old system: $150 individual contribution, $600 public matching funds, $750 total. New system: $250 individual contribution, $700 public matching funds, $950 total.
County Council candidate
Old system: $150 individual contribution, $450 public matching funds, $600 total. New system: $250 individual contribution, $550 public matching funds, $800 total.
How much more would this cost the taxpayers? That’s hard to estimate. The bill’s fiscal note assumes that everyone who gave the maximum $150 contribution in 2018 would give a $250 contribution if allowed and uses the 2018 election as a baseline. (Those are big assumptions, but the fiscal note is what it is!) Using those criteria, the fiscal note estimates that matching funds for $250 contributions would have generated an extra $487,034 in taxpayer costs in 2018, or a 9% increase.
Now let’s not set that number in stone. First, 2018 saw a genuinely contested county executive general election, a very rare event in MoCo politics. Second, there is no guarantee that 2022 will see as many candidates as last time primarily because there may be only one open at-large seat following three open at-large seats in 2018. Third, if Question C (which adds two district seats) passes, there will be more open seats, more candidates and more costs. So if passed, the bill’s extra costs could be higher or lower than the fiscal note’s estimate. But there will be extra costs compared to the current regime.
Why does the bill increase both the maximum individual contribution and the matching funds? There is no reason to believe that public financing levels are inadequate. Six of the nine sitting council members and the county executive used public financing two years ago. All of them faced opponents using traditional financing and still won. The winning candidate for county executive, Marc Elrich, raised $1.9 million in public financing combining the primary and general elections. Four council at-large candidates in public financing (Will Jawando, Evan Glass, Hans Riemer and Bill Conway) raised more than $300,000 each, which is comparable to past totals of leading candidates in the traditional system. Two more (Gabe Albornoz and Hoan Dang) raised more than $250,000. Jawando raised more than $400,000. Again, there is no shortage of money here.
As part of its process in considering the bill, the council surveyed eleven candidates who used public financing in 2018 on their views of necessary changes. Just three candidates recommended increasing the public matching amount and only two candidates recommended increasing the maximum donation. There was little demand for this cost increase. Nevertheless, it somehow made it into the bill. All three members of the Government Operations Committee supported raising the maximum donation from $150 to $250. Sidney Katz and Nancy Navarro voted in favor of a dollar-for-dollar match for the difference between $150 and $250 while Andrew Friedson voted against a funding match for the new hundred dollar increment.
Arranging for what could be a substantial cost increase in public financing – an increase that would be even larger if Question C passes – while at the same time adding council staff, refusing to fund collective bargaining agreements and perhaps making program cuts in the near future would not be a good look for the county council. The council is also being closely watched by advocates of Question B (which would cap property tax growth) and Question D (nine council districts), all of whom will use spending increases for politics to bolster their messages. Raising the contribution limit is one thing; it costs taxpayers nothing. But the council should hold off on changing funding formulas to spend more taxpayer money on their political campaigns.