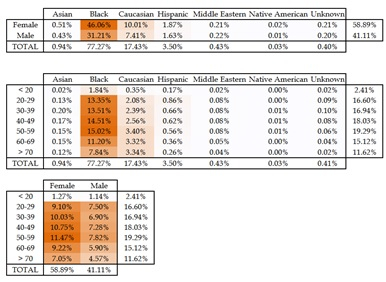
Today, 7S looks at the likely demographic composition of the electorate in the Fourth Congressional District. Many thanks to my anonymous reader who has so helpfully shared these statistics with me. The first table shows the share registered Democrats in CD 4 broken down by (1) race and gender, (2) race and age cohort, and (3) gender and age cohort.
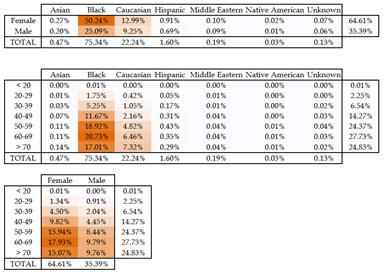
 The second table presents the same three demographic breakdowns but for voters who participated in two of the last four Democratic primaries. Close examination of the data reveals key differences between the makeup of the potential electorate of registered Democrats and likely voters, defined here as those who have voted in two of the last four primaries.
Race and Ethnicity
First, African Americans will form an overwhelming share of the electorate as they comprise 77.3% of registered Democrats and 75.3% of likely voters.
Latino form 3.5% of registered Democrats but this growing demographic punches below its weight, as Latinos composed just 1.6% of likely voters. However, Latino voter turnout has been steadily increasing, so the turnout over the past four primaries may well underestimate the share of Latinos who will vote in the 2016 Democratic primary.
In contrast, Whites, listed in the table as Caucasians, vote a high rates. They form 17.4% of registered Democrats but 22.2% of likely Democratic primary voters. So far, all of the candidates who are still in the mix for the race are African American. An ability to attract white voters will aid a candidate’s campaign greatly.
Voters would do well to remember that Rep. Al Wynn won this seat originally through his biracial appeal. He came in second in both Prince George’s and Montgomery but defeated a black candidate with support centered in Prince George’s and a white candidate with support primarily in Montgomery.
Similarly, support from whites and Latinos in Montgomery played a critical role in Rep. Donna Edwards’ successful primary challenge to Rep. Al Wynn. In short, candidates who can combine significant black and white support tend to be formidable.
Gender
Women are an impressive 58.9% of registered Democrats but an astounding 64.6% of primary voters. At nearly two-thirds of likely voters, expect candidates to spend a lot of time at events that attract especially high numbers of women.
Candidates will also work hard to identify concerns that can attract a disproportionate share of their votes. No group or gender is monolithic in its voting behavior but some issues resonate with greater effect with women than men.
Race, Gender, and Age
Older voters participate at much higher rates than younger voters in Democratic primaries. Consider than 26.7% of registered Democrats but 52.6% of likely voters are over age 60. If voters wonder why they hear candidates talk a lot more about social security and health care than education, now they know.
African Americans over 60 form 37.7% of the electorate. African Americans over 50 are 56.7% of the electorate. Black women compose the bulk of these voters because (1) women register disproportionately as Democrats, and (2) the gender breakdown of population skews more female among older people.
In the overall population aged 20 to 60, there are roughly 1.03 women for every man among the civilian non-institutionalized population. Those numbers rise dramatically for older people. There are 1.22 women for each man in the over 60 population. That ratio rises to 1.26 for the over 65s and 1.35 for the over 70s.
Older people, especially older women, will play a disproportionate role among white voters too. Likely voters aged 60 and older form 62.0% of white voters. Again, expect these voters to be disproportionately female.
Key Demographics
Likely voters tend to be Black, older, and female. While every individual voter counts and matters, older Black women will be the central force in the Democratic primary for CD 4.
Whites, particularly older White women, can potentially play a pivotal role, as they form over one-fifth of likely voters. Expect all candidates to court this group. Black voters often play a similar role in Democratic primaries in white majority areas.