Tag Archives: 2020 precinct results

MoCo Turnout 2020: Party Splits

By Adam Pagnucco.

Eighty percent of MoCo voters turned out in the 2020 general election, about average for a presidential year. In splicing the data, I did not find large variations in turnout rate by geography. The highest turnout was in Leisure World (85%) and the lowest was in Glenmont/Norbeck (73%). But there was significant variation in party turnout by area, demonstrating one of MoCo’s least appreciated characteristics: its political heterogeneity.

MoCo is thought of as a blue county, and at first glance, it is. All of the county’s partisan elected officials have been Democrats since 2006 and Democratic candidates for statewide office and president have won here for decades. But there are big political differences between parts of the county. For example, while Takoma Park is one of the most progressive areas in the United States, Republicans are competitive in Damascus.

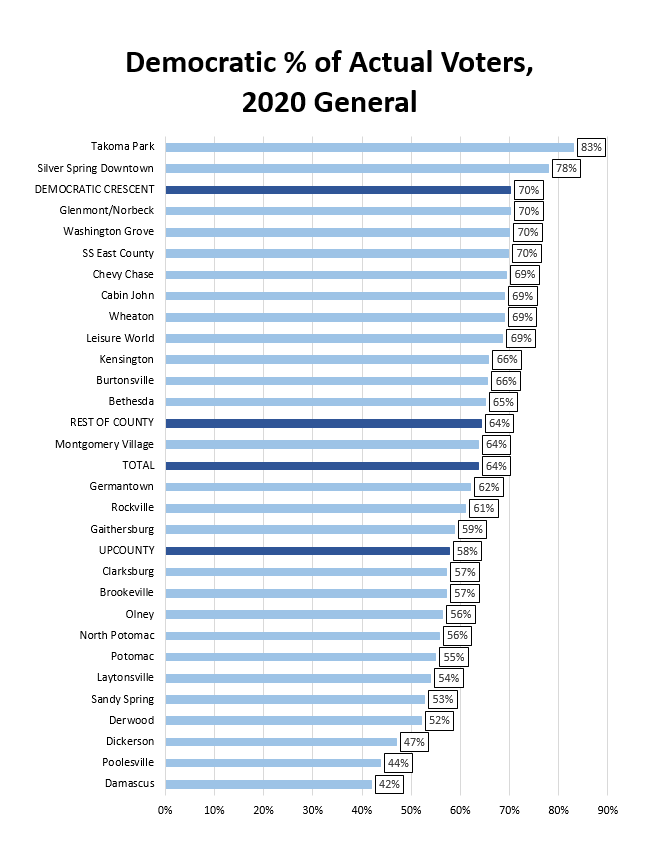
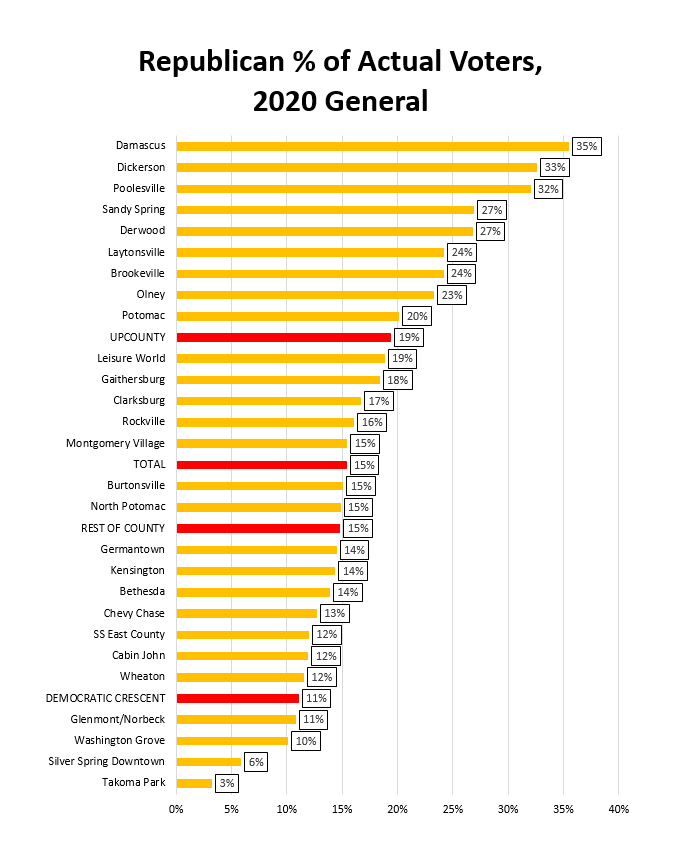
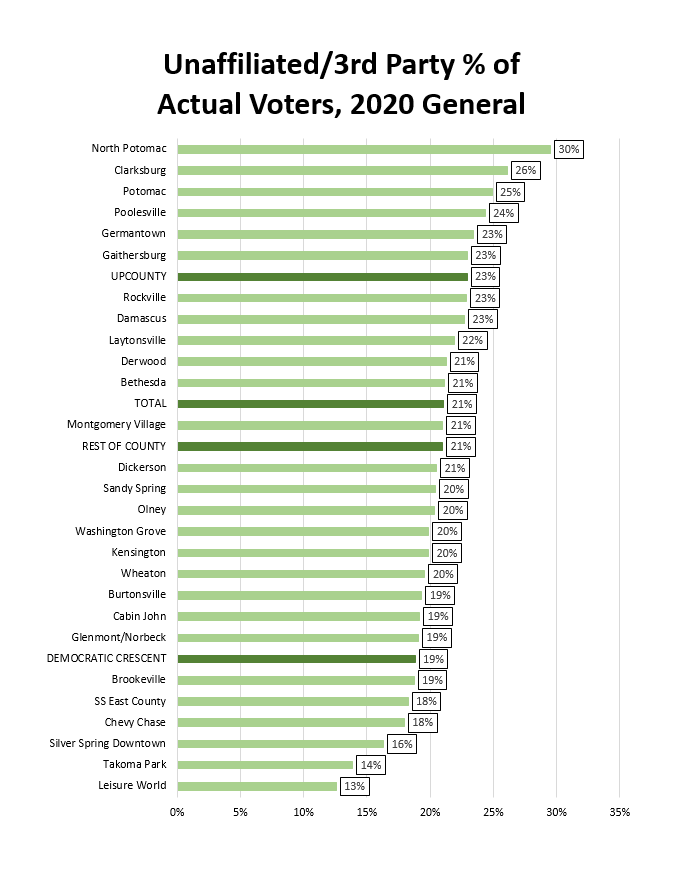
The charts below show the percentage of MoCo voters who were Democrats, Republicans and unaffiliated or third party voters in the 2020 general election. The source of the data is the State Board of Elections. (See here for my methodology and definitions.) This information shows the differences in party participation by area.

Democrats

Democrats comprised 70% or more of the voters in the Democratic Crescent (the areas inside and near the Beltway), Downtown Silver Spring, Takoma Park and most of east county. Crescent voters play out-sized roles in Democratic primaries and were key to depressing Governor Larry Hogan’s MoCo vote percentage in 2018. Democrats were less dominant in upcounty and fell short of a majority of voters in Dickerson, Poolesville and Damascus.
Republicans

Republicans were just 15% of actual voters countywide. But they accounted for a quarter or more of voters in some parts of upcounty and were a third or more in Dickerson, Poolesville and Damascus. While the GOP has some pockets of influence here, they are in long-term decline in MoCo as I will discuss in a future post.
Unaffiliated/Third Party

Of the 156,702 eligible MoCo voters who were not Democrats or Republicans, 147,417 (94%) of them were unaffiliated. Unaffiliated and third party voters together accounted for 21% of actual voters, more than the Republicans. It’s probably not a coincidence that North Potomac, Clarksburg and Potomac had the highest percentages of these voters as those areas have concentrations of Asian residents. Many Asian voters don’t choose party affiliation and they tend to be politically diverse. It remains to be seen how the Trump presidency will affect their party choices in registration and voting over the long term.
One effect Trump did have was to stimulate a surge in voting among MoCo Democrats, as we will explore in a future post. There was also a lot of partisan activity around the four county ballot questions last year which gave the Democratic Party a lot of influence over their chances of success. That may not always be the case in the future, and if it’s not, Republicans and unaffiliated voters can still play a role in coming general elections.

Share

Methodology Note: Precinct Analysis

By Adam Pagnucco.

In coming days, I’ll be crunching precinct-level results from the 2020 general election. This post summarizes the methodological choices I made and I’ll refer back to it in the future.

General election precinct results for candidate races and ballot questions are available here for every county in Maryland. In prior years, precinct results were available only for election day voting. For this year’s general election (but not the primary), they are available for all voting modes. That’s an improvement but it means that precinct results for this year aren’t strictly comparable to earlier years.

This year, Montgomery County has 258 precincts. Three of them are “ghost precincts,” which do not report results because no people live in them. If you see the number of precincts alternatively represented as 258 or 255, the three ghost precincts are the reason. Don’t worry about it because vote tallies are unaffected.

All precincts are assigned to congressional, state legislative and council districts. Their town designation is determined by the location of the voting place. This gets a little blurry at times as folks from one town can have a voting place in another, but this shouldn’t have a huge impact on geographic results.

The Democratic Crescent, a term I used two years ago to identify regularly voting downcounty Democrats, includes precincts in Bethesda, Cabin John, Chevy Chase, Kensington, Takoma Park and Silver Spring inside the Beltway. Upcounty includes precincts in Brookeville, Clarksburg, Damascus, Dickerson, Gaithersburg, Germantown, Laytonsville, Montgomery Village, Olney, Poolesville, Sandy Spring and Washington Grove. Residents of smaller nearby communities vote in these precincts, including people who live in Ashton, Barnesville, Beallsville, Boyds and Goshen. Wheaton includes zip code 20902. Glenmont/Norbeck includes zip code 20906, except for Leisure World, which is tracked separately. Silver Spring East County includes all other Silver Spring precincts outside the Beltway and located in zip codes 20901, 20903, 20904 and 20905.

I may refer to how precincts voted for term limits in 2016. Term limits voting is correlated both with partisan turnout and certain other voting behavior this year.

I included estimates of average household income by zip code from the Census Bureau for the five-year period of 2014-2018. I wish I had recent estimates by precinct but that will hopefully be released with the next batch of decennial census data.

Finally, I took a shot at demographics by precinct. This was a huge and imprecise exercise. Using 2010 census data, I matched census blocks to precincts. This is challenging because the two frequently don’t match exactly and precinct definitions have changed over the years. After a great deal of work, I was able to generate rough estimates of percentage Asian, Black, Latino and white for each precinct’s population and use them to gauge crude patterns of voting associated with race. I can’t stress how rough and dated this is and I look forward to getting updated 2020 census data to plug in.

That’s about it. We’ll start digging into data soon!

Share

Trump vs Hogan: Votes by MoCo Town

By Adam Pagnucco.

In what amounts to an early Christmas for this number cruncher, the State Board of Elections has released precinct voting data for candidate races and ballot questions. We are going to have a lot more of this in coming days, but here is a very quick cut comparing outgoing (yes, outgoing) President Donald Trump with Governor Larry Hogan.

In the 2020 general election, Trump received 19% of the vote in MoCo. In the 2018 general election, Hogan received 44% of the vote in MoCo, probably the highest percentage for a Republican in a MoCo gubernatorial general since Spiro Agnew won the county in 1966.

In comparing the two, there are two caveats. First, the electorate in the 2020 general election (more than 517,000 voters in MoCo) was bigger than the electorate in the 2018 general election (413,137). That means these are different groups of voters, although the Democratic percentage of the electorate in 2020 (64%) is about the same as in 2018 (65%). (The state has not released official turnout numbers yet for 2020, making these numbers approximate.)

Second, 2020 precinct level data includes all voting modes whereas 2018 included election day votes only. Election day votes accounted for 61% of all MoCo votes cast in the 2018 general election, and the Democratic percentage of the electorate (61%) was lower than the Democratic percentage of other voting modes (71%). That skews the 2018 precinct results in Hogan’s favor a bit. Hogan won 47% of MoCo’s election day votes whereas he won 44% of MoCo’s general election votes overall.

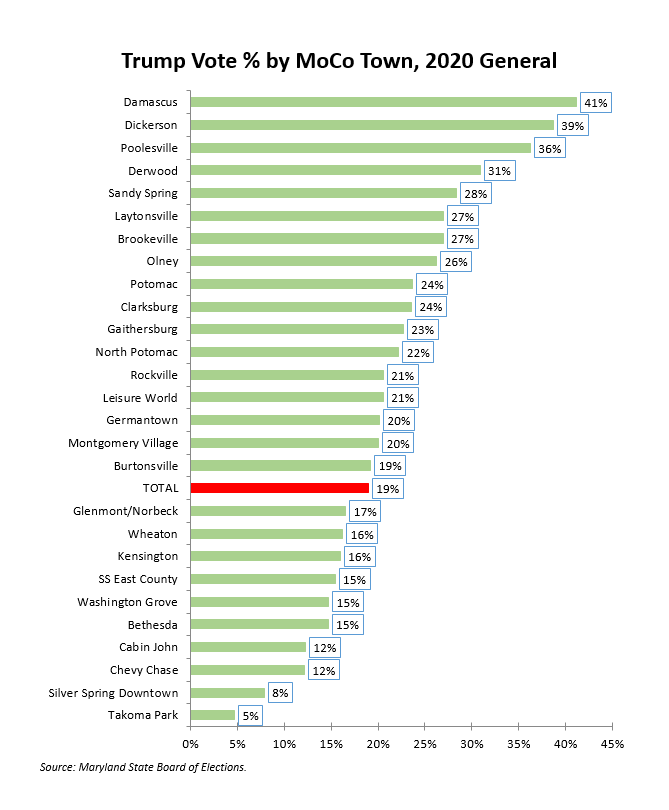
All of the above said, the chart below shows Trump’s vote percentage by MoCo town in the 2020 general election.

These results are predictable. Trump only won one precinct out of MoCo’s 258 precincts: 12-1 in Damascus, where he tallied 962 votes vs Joe Biden’s 926. Trump did particularly badly in the Democratic Crescent, pulling in the teens and single digits there.

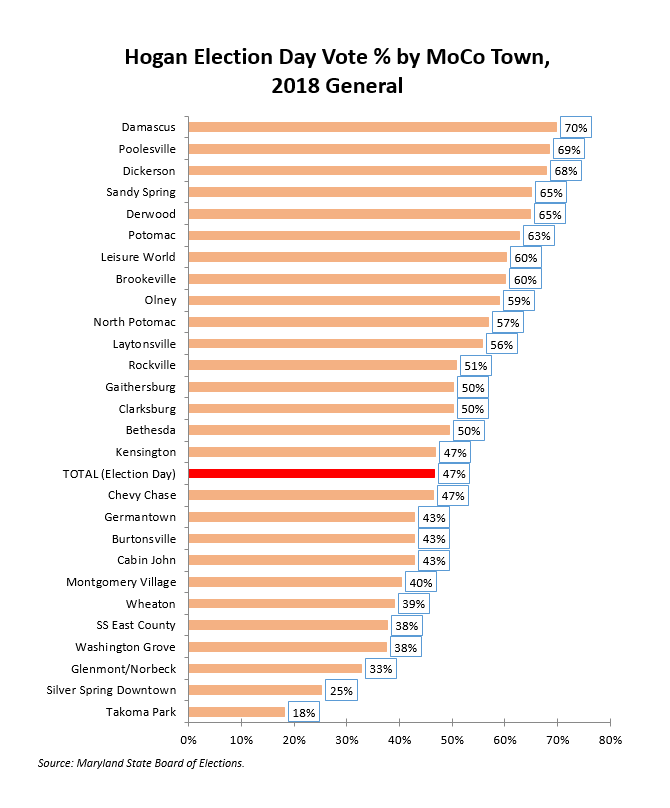
The chart below shows Hogan’s election day vote percentage by MoCo town in the 2018 general election.

In terms of election day votes only, Hogan won many areas in MoCo. Even if other voting modes were included, Hogan probably won in Brookeville, Damascus, Derwood, Dickerson, Laytonsville, Leisure World, North Potomac, Olney, Poolesville, Potomac and Sandy Spring. Hogan’s overall loss in MoCo was due to lopsided defeats in Silver Spring and Takoma Park, not to geographically broad unpopularity.

This goes to show that a fiscally conservative, socially agnostic and politically strategic Republican can get a lot of votes here, especially in upcounty. But Trumpism is a huge loser in MoCo.

Share