
In two posts yesterday, I argued that Maryland’s congressional redistricting plan is less outrageously biased to the Democrats than assumed by many despite its extremely non-compact lines. This post focuses on why pretty, compact lines may not produce plans that treat both parties fairly.
First, one can still gerrymander without necessarily producing especially non-compact shapes. In the 1980s, Arizona GOP adopted a plan that did not look particularly bad but still worked greatly to their benefit by packing Democrats into a single district.
The one Democratic district had a reasonably regular triangular shape. But it stretched across hundreds of miles of empty desert with its vertices being Yuma along with the especially Democratic sections of Phoenix and Tucson.
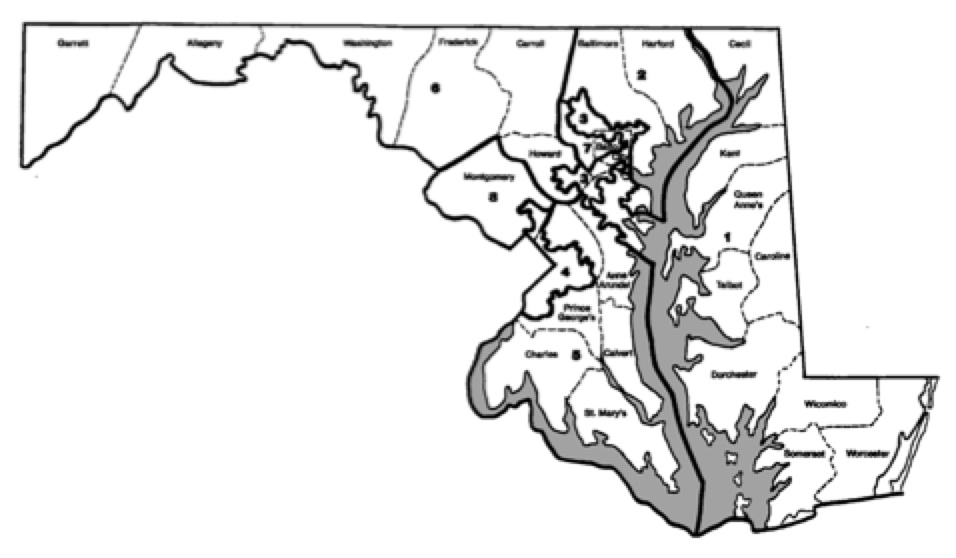 Maryland Congressional Plan 1992-2000
The Maryland plan used from 1992 through 2000 may not have been as compact as possible but was much more so than the current plan. Though drafted by Democrats, it didn’t work very well for them in the 2000 elections.
 2000 Maryland Congressional Results
The Democrats won by more than 200,000 votes, or 11%, but still only won 50% of the eight seats. Usually, though by no means always, a clear win in votes will give the majority party more than its fair share of seats.
As this example demonstrates, the outcome in single-member district electoral systems depends heavily upon how the votes are distributed. Parties lose out when they supporters are not efficiently spread across the state.
Parties whose voters are too packed–that is, over concentrated–into a few districts will win those districts by wide margins but forgo opportunities to gain neighboring districts. On the other hand, parties with supporters spread too thinly risk winning no seats even if they receive many votes. In winner-take-all elections, there is no prize for second place.
The distribution of voters often has a major impact on election outcomes even if constituency boundaries are drawn by excellent nonpartisan procedures. The United Kingdom has nonpartisan boundary commissions draw their maps. Yet they hardly treat the two largest parties equally.
Between 1979 and 1992, the Conservatives won four straight elections with between 42% and 44% of the vote. Their majorities varying greatly in size, ranging from 52% to 61% of parliamentary seats. They performed at their best in 1983 when the second and third place parties nearly tied, leaving the Conservatives ahead in more seats than other years.
Labour won 41% to 43% of the vote in 1997 and 2001 but gained more substantial majorities–62% to 63% of all seats–than the Conservatives did with about the same vote share. In 2005, Labour even gained a majority of 55% of seats with just 35% of the vote, the lowest share in British history. However, the Conservatives gained only a minority in 2010 with 36% of the vote.
The key lesson is that maps with compact districts and regular lines do not necessarily produce unbiased outcomes that reward parties with an equal number of seats for the same share of votes. The distribution of voters is critical.
Next up: competitiveness, responsiveness and redistricting.
