Tag Archives: compactness

Does the Frederick Donut Violate the Constitution?

Proposed Frederick County Legislative Districts

Maryland Matters reports that one Republican legislator has raised questions regarding whether the legislative districts proposed for Frederick County would pass constitutional muster:

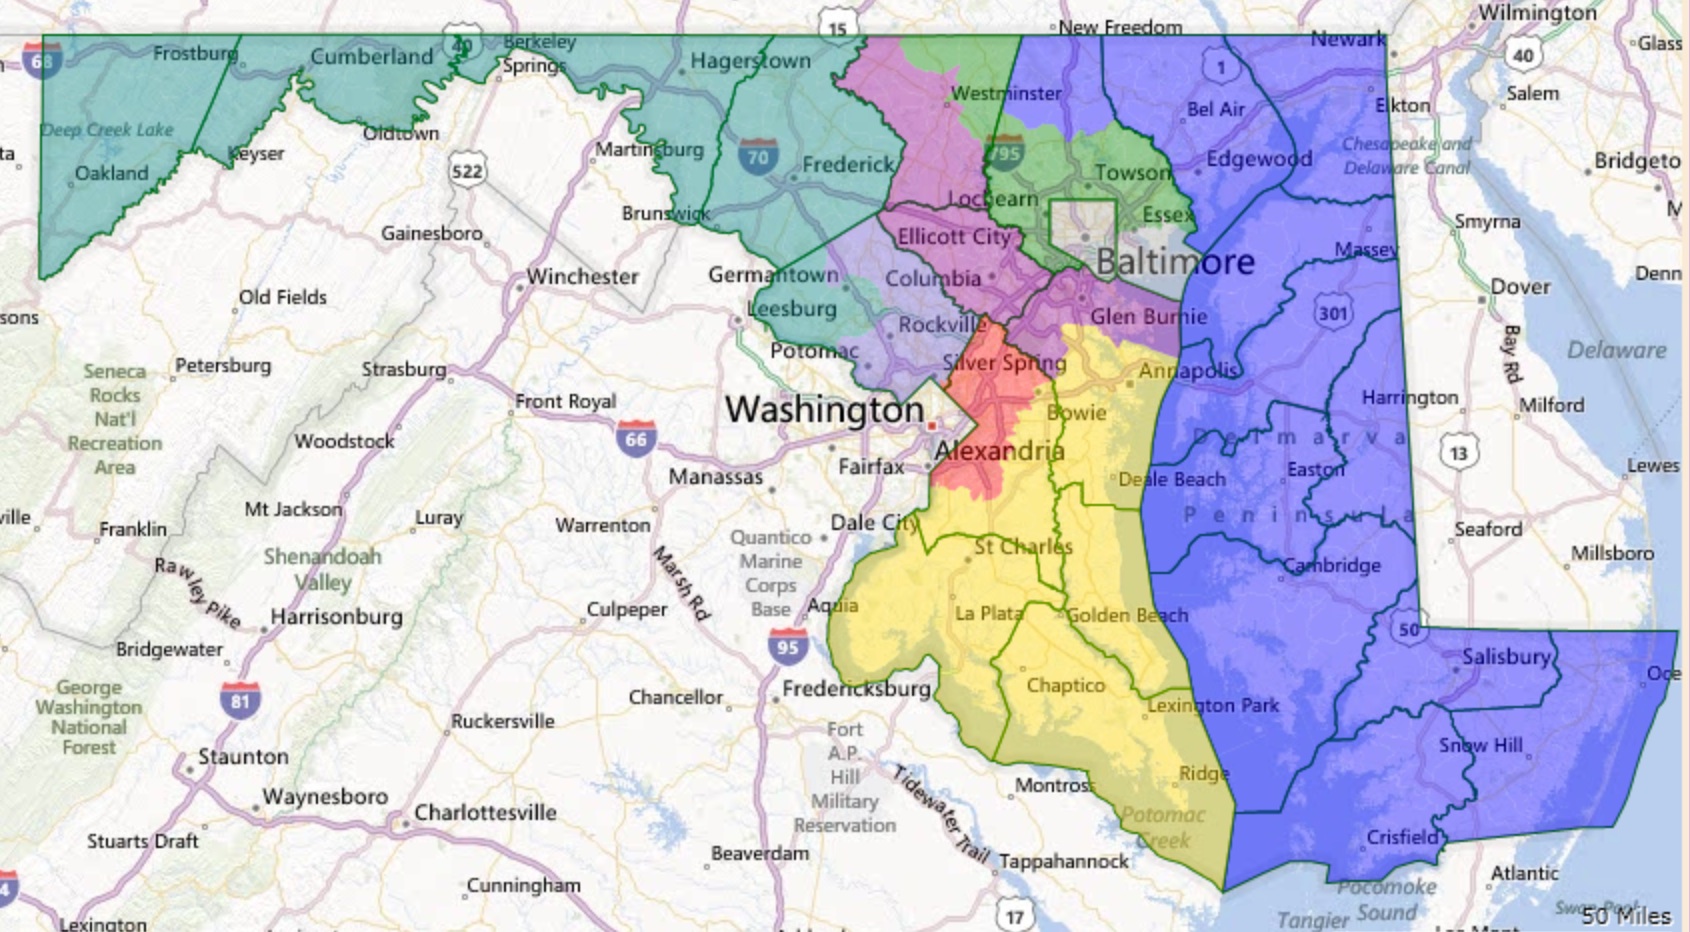
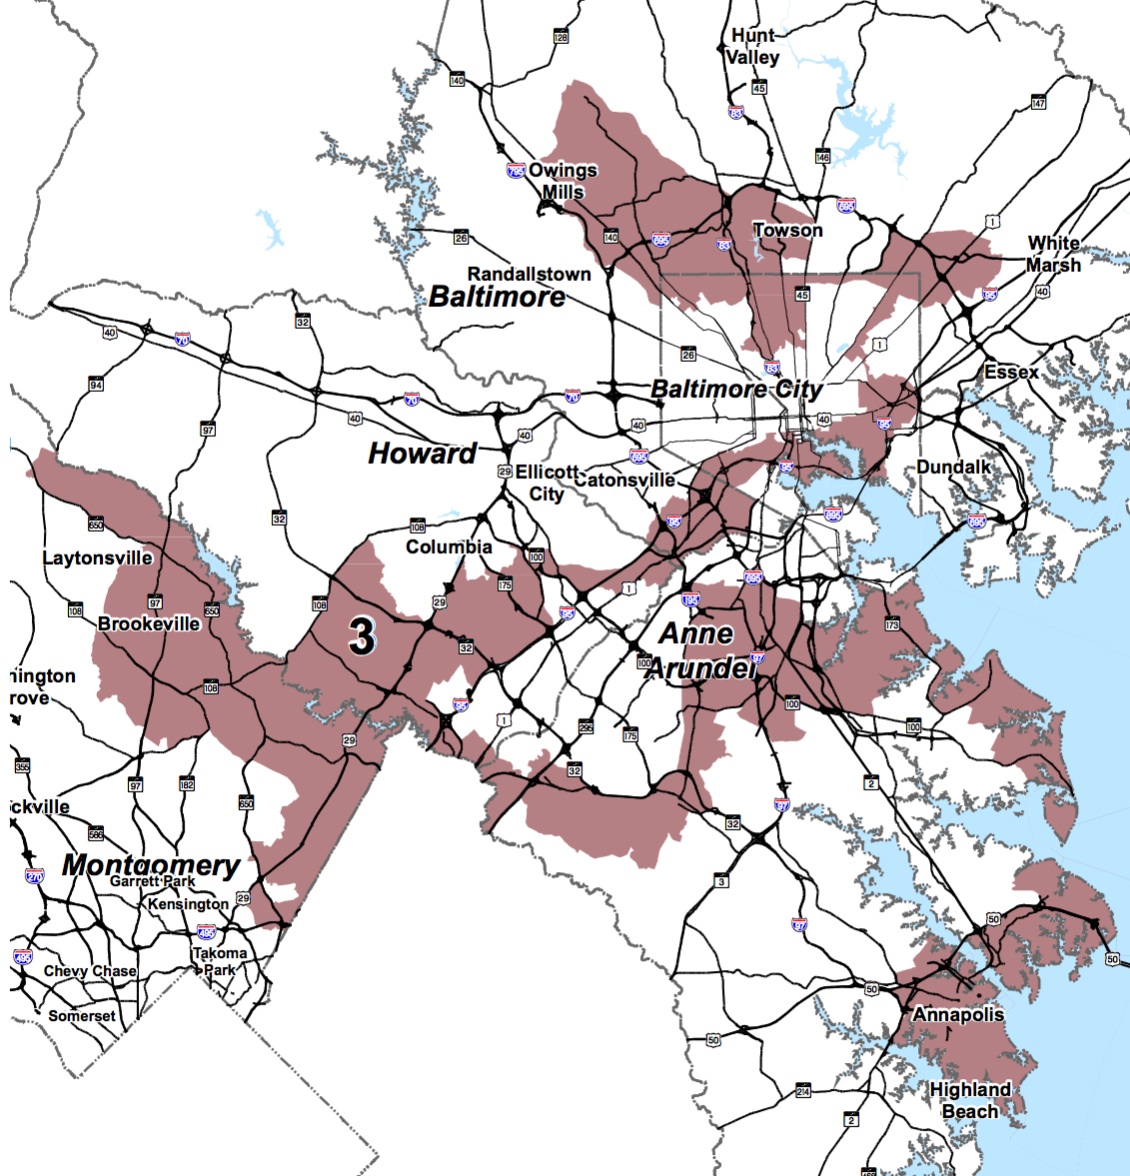
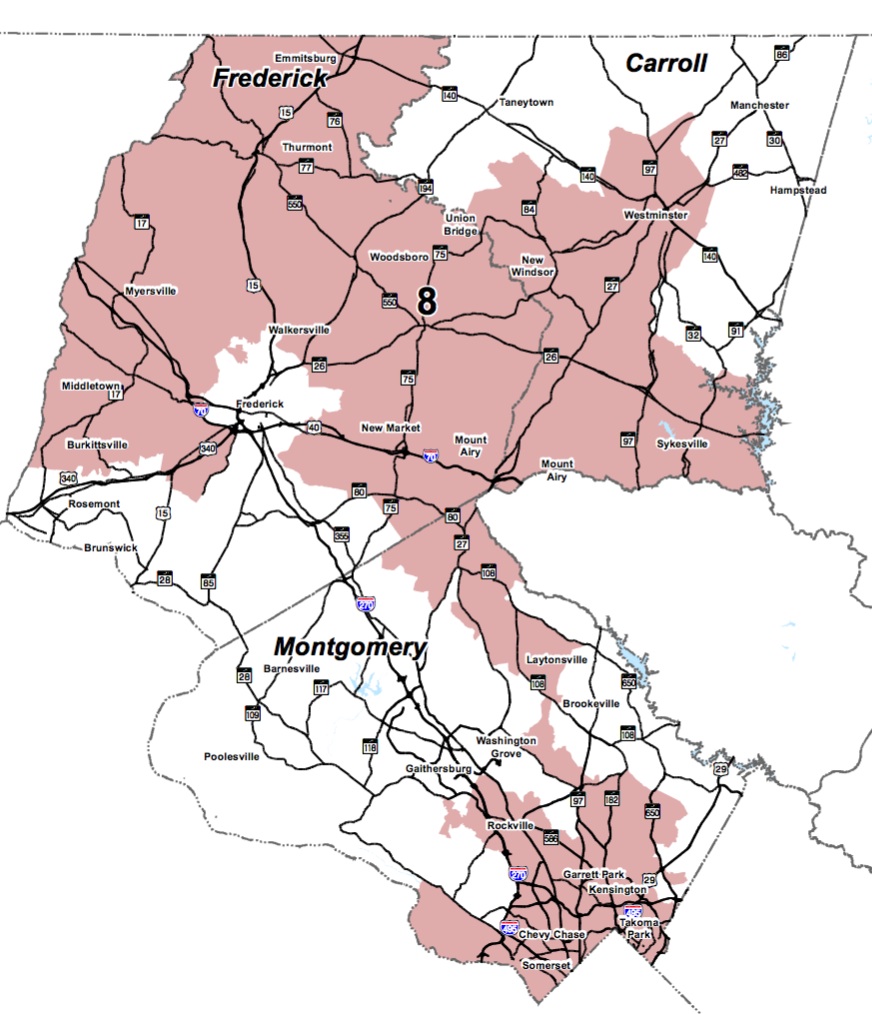
Del. Jason C. Buckel (R-Allegany), the House minority leader and a member of the Legislative Redistricting Advisory Commission, questioned whether the new proposed District 4 would pass muster for compactness. The proposed District 4 would encompass much of Frederick County around the city of Frederick, which is contained within District 3, creating what Buckel described as a “donut effect.”

Del. Buckel is almost certainly wrong. The donut does not exist in spite of the Maryland Constitution but to comply with it. Ironically, this is for the same reason that I expressed concern in yesterday’s post about whether District 17 can survive a constitutional challenge: the requirement of “due regard” for “the boundaries of political subdivisions.”

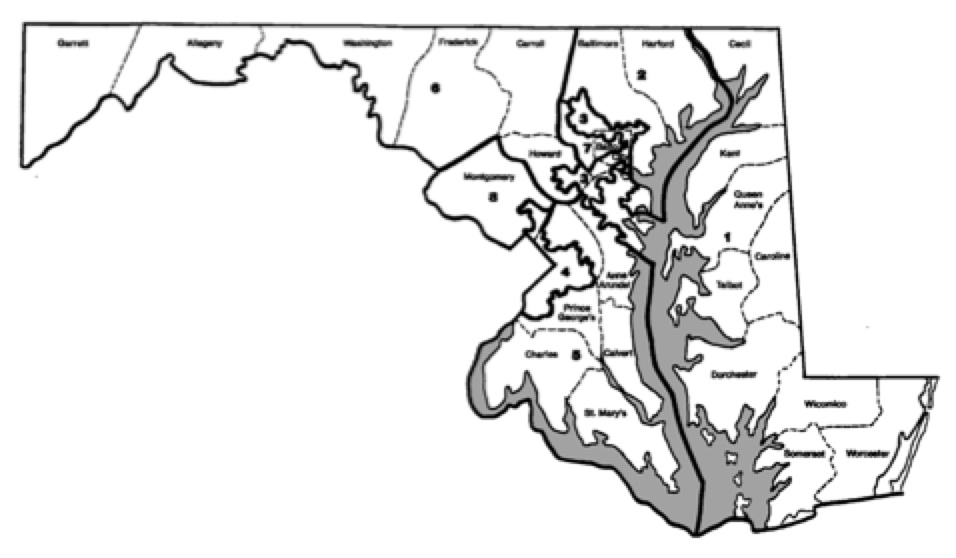
This same provision indicates that the City of Frederick ought to be kept in a single legislative district if possible unless it conflicts with other requirements. At this point, the population of the City and its surrounding suburbs is sufficiently high as to easily meet the population for a legislative district, resulting in a more compact shape than the existing plan in which District 3 extends to the Virginia border.

Putting most of the rest of Frederick County into a surrounding legislative district is the logical consequence of same provision requiring “due regard” of administrative divsions as it avoids unnecessarily extending District 4 into another county.

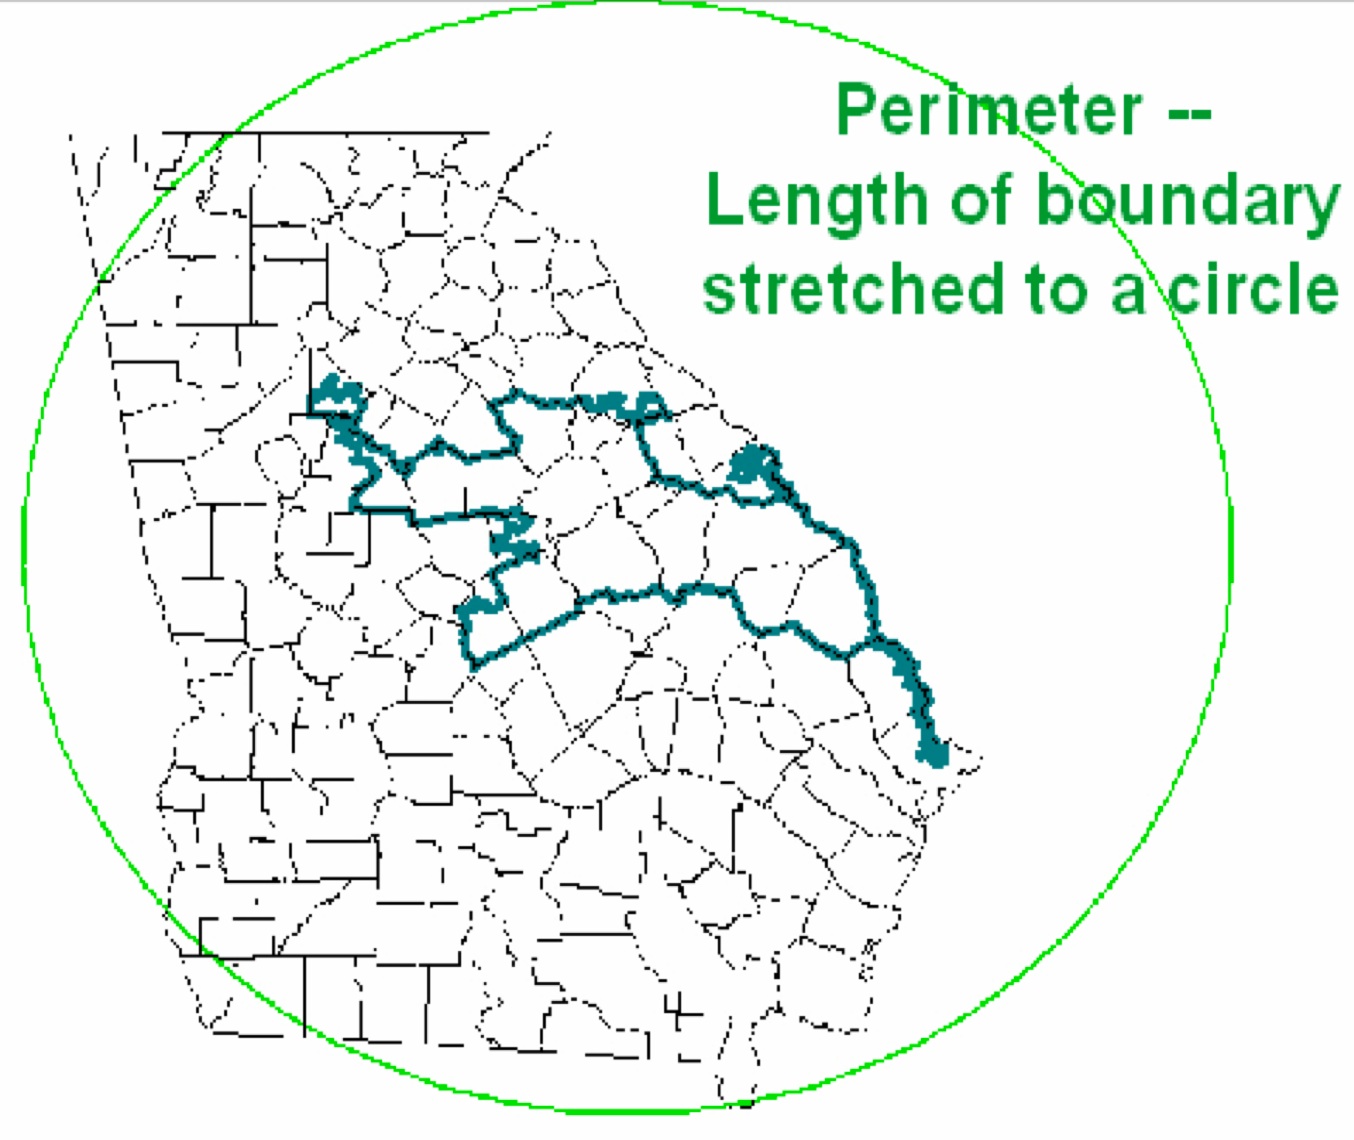
Del. Buckel’s point reflects that the Maryland Constitution also says that legislative districts should “be compact in form.” But it’s not clear that extending District 3 to the Montgomery County line would improve the compactness of either Districts 3 or 4. It might lengthen the perimeters of both Districts 3 and 4 and reduce compactness according to measures that have been commonly used in past redistricting litigation. One would have to look to be sure either way but I doubt it would be nearly enough to cause a court to second guess the legislature’s approach.

Bear in mind also that District 3 is not an independent enclave trapped by its neighbor. It’s not Lesotho. Enclosing District 3 in District 4 doesn’t make it impossible to leave District 3 without a passport. The City of Frederick isn’t being deprived of a seaport.

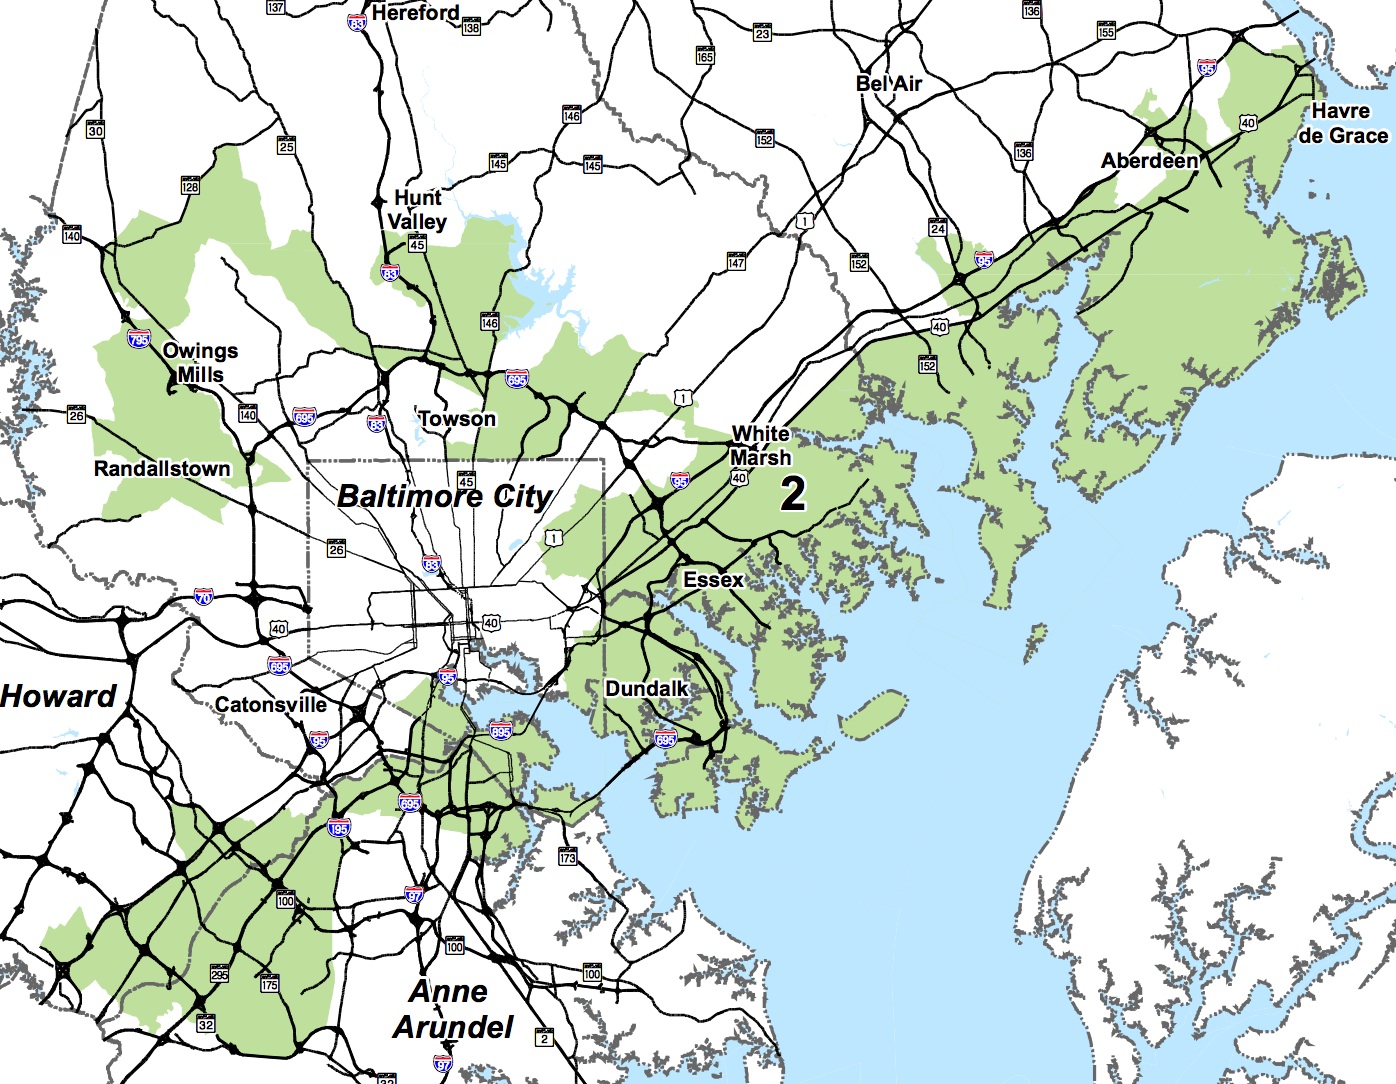
Others might wonder about why a bit of District 2 extends into Frederick County.

Proposed Western Maryland Legislative Districts

That’s easily explainable by the State’s geography and population changes. District 1 must start in Garrett County, take in all of Allegany County and then the western part of Washington County to pick up enough population.

Currently, District 2 neatly comprises the remainder of Washington County with the Washington-Frederick border serving as its eastern boundary. That’s no longer possible. The western three counties continue to lose population relative to the rest of the state, so the districts encompassing them move east with each redistricting cycle. At this point, they must extend into Frederick.

The good news is that Frederick has grown sufficiently that the ripple effect stops there. Unlike under the existing plan, none of the proposed districts traverse Frederick’s border with Carroll County.

Share

Competition and Responsiveness in Redistricting

In previous posts, I’ve contended that Maryland’s extremely non-compact districts are nonetheless less skewed to the Democrats than many think. Moreover, compactness and non-partisan maps don’t necessarily result in fair outcomes.

Today, I look at the role of redistricting in promoting competition and responsiveness. The argument in favor rests on the idea that competition is the lifeblood of democracy. It helps voters keep politicians accountable. When voters swing away from one party and to another, the results should reflect the change.

It may seem odd to take into account whether a plan creates competitive districts. However, the Arizona Independent Redistricting Commission operates under a mandate to prioritize them. It would also potentially result in greater shifts in House seats with changes in the vote for the U.S. House.

Not all agree that competition and responsiveness are a good thing. Tom Brunell has provocatively argued that mapmakers should create as many ultra-safe districts as possible. He points out that fewer voters cast ballots for the losing candidate–and therefore are happier with the outcome–in safe districts.

Let’s work with the other side of the argument, as I suspect more prefer responsiveness to changes in voting behavior rather than static outcomes no matter the election results. How well does Maryland’s current plan promote competition (i.e. close elections) or responsiveness (i.e. changes in seats won with changes in voting behavior)?

Not well. In 2012. the closest race was in the Sixth where challenge John Delaney ousted incumbent Rep. Roscoe Bartlett by 21 points. The next closest race was in the Eighth where Rep. Chris Van Hollen won reelection from his redrawn district by over 30 points.

If Republicans have a problem with the map, it should not be that it is inherently unfair. After all, if Maryland Republican candidates could win one-half of the votes, they likely carry one-half of the seats. Nevertheless, the plan doesn’t look likely to respond to less major changes in the electorate.

Below is a rough draft of a plan that reflects the Democratic edge but is likely to be more responsive to changes in electoral outcomes:

LublinPlan1More Competitive Congressional Redistricting Plan

President Obama won a majority in 2008 in seven of the eight districts. However, his victory level was not nearly as high in several of the districts as under the current plan:

MDCompIn this plan, the Republicans would need a shift of only 1.9% to gain the Third District and 3.0% to gain the Sixth District. One can imagine regular heated competition for both districts with them changing hands depending on the vicissitudes of the electorate.

This plan would also be far more compact and violate fewer county boundaries than the current plan. The 1st would contain the entire Eastern Shore along with Harford and a bit of northern Baltimore County. It does not cross the Bay Bridge. The Seventh, a 54% black voting-age population district, would include all of Baltimore City along with a chunk of neighboring Baltimore County.

The new 2nd would take in the remainder of Baltimore County along with a bit of neighboring Carroll. The 8th is entirely in Montgomery County. The 6th includes all of western Maryland along with almost all of the rest of Montgomery. The 4th, a 61% black VAP district, is almost entirely in northern Prince George’s.

Finally, the 5th is composed of southern Maryland, the rest of Prince George’s and southern Anne Arundel. The 3rd becomes a central Maryland district with all of Howard, northern Anne Arundel and most of Carrol Counties.

The major problem with this plan is that is most likely too favorable to the Republicans. A gain of 7.8% of the vote would allow the GOP to win one-half of the districts even though they would fall far short of the vote share required for an even statewide split.

They might even win all four with an even smaller percentage as the new versions of the 2nd, 3rd, and 6th contain above average shares of white voters. This matters because whites are more likely to shift way from the Democrats when a pro-Republican wind blows than black voters, who are highly concentrated in the 4th and 7th.

So greater competition and responsiveness not always conducive to partisan fairness. However, one might be able to construct a plan that better meets both requirements, though that could result in less compact districts.


Share

All the Pretty Districts

In two posts yesterday, I argued that Maryland’s congressional redistricting plan is less outrageously biased to the Democrats than assumed by many despite its extremely non-compact lines. This post focuses on why pretty, compact lines may not produce plans that treat both parties fairly.

First, one can still gerrymander without necessarily producing especially non-compact shapes. In the 1980s, Arizona GOP adopted a plan that did not look particularly bad but still worked greatly to their benefit by packing Democrats into a single district.

The one Democratic district had a reasonably regular triangular shape. But it stretched across hundreds of miles of empty desert with its vertices being Yuma along with the especially Democratic sections of Phoenix and Tucson.

MD1990sCDsMaryland Congressional Plan 1992-2000

The Maryland plan used from 1992 through 2000 may not have been as compact as possible but was much more so than the current plan. Though drafted by Democrats, it didn’t work very well for them in the 2000 elections.

MD2000CDelection2000 Maryland Congressional Results

The Democrats won by more than 200,000 votes, or 11%, but still only won 50% of the eight seats. Usually, though by no means always, a clear win in votes will give the majority party more than its fair share of seats.

As this example demonstrates, the outcome in single-member district electoral systems depends heavily upon how the votes are distributed. Parties lose out when they supporters are not efficiently spread across the state.

Parties whose voters are too packed–that is, over concentrated–into a few districts will win those districts by wide margins but forgo opportunities to gain neighboring districts. On the other hand, parties with supporters spread too thinly risk winning no seats even if they receive many votes. In winner-take-all elections, there is no prize for second place.

The distribution of voters often has a major impact on election outcomes even if constituency boundaries are drawn by excellent nonpartisan procedures. The United Kingdom has nonpartisan boundary commissions draw their maps. Yet they hardly treat the two largest parties equally.

Between 1979 and 1992, the Conservatives won four straight elections with between 42% and 44% of the vote. Their majorities varying greatly in size, ranging from 52% to 61% of parliamentary seats. They performed at their best in 1983 when the second and third place parties nearly tied, leaving the Conservatives ahead in more seats than other years.

Labour won 41% to 43% of the vote in 1997 and 2001 but gained more substantial majorities–62% to 63% of all seats–than the Conservatives did with about the same vote share. In 2005, Labour even gained a majority of 55% of seats with just 35% of the vote, the lowest share in British history. However, the Conservatives gained only a minority in 2010 with 36% of the vote.

The key lesson is that maps with compact districts and regular lines do not necessarily produce unbiased outcomes that reward parties with an equal number of seats for the same share of votes. The distribution of voters is critical.

Next up: competitiveness, responsiveness and redistricting.

Share

Compactness in Redistricting

When people refer to geographical compactness, they refer to districts of sensible shape. Why does this matter? First, odd shapes can indicate gerrymandering. Second, the idea of single-member districts is grounded in the representation of territorially organized communities where each area has its representative, though many dispute this idea of community.

One common compactness measure, usually referenced as the Reock or Dispersion measure, is the ratio of the area of a district to the area of the smallest circle that can enclose the district:

Reock

Reock or Dispersion Measure of Compactness

The idea behind the measure is that a circle is the most compact shape, so it compares the district to the smallest circle that can encompass it. As the name indicates, it is viewed as a good measure of the dispersion of the area of a district.

Another widely used compactness measure is the ratio of the area of a district to the area of a circle with the same perimeter as the district (the Polsby-Popper or Perimeter measure):

Polsby-Popper

Polsby-Popper or Perimeter Measure

This measure tends to give low (i.e. worse) scores to districts with many crinkles in their boundaries and that are elongated in ways that stretch their boundaries but encompass little territory. In contrast, districts with smooth boundaries that maximize the area enclosed score well.

Complaints about both measures include that one cannot draw only circular districts and that state boundaries are not circular. For this reason, it is important to compare district scores to other districts and especially other plans for districts in the same state.

A final compactness measure is the Grofman Interocular Test. Developed by my humorous friend and sometime coauthor, Bernie Grofman, it’s his way of asking does “evidence of gerrymandering leap up and hit you in the eyeballs.” Rather like Justice Stewart said about pornography, gerrymandeirng can be hard to define but you know it when you see it.

Closely related to compactness are the ideas of contiguity and adherence to administrative boundaries. Contiguity is simply that one could, at least in theory, travel from any point in a district to any other point without leaving the district. A stricter version might require that one can travel in practice without having to cross into another district.

Federal law now requires that congressional districts be contiguous in the looser sense. In recent times, some districts have stretched the principle thinly with point contiguity, which is when districts remain connected at just one point.

Others value adherence to administrative boundaries, such as county and municipal lines, as helping preserve natural communities of interest. Of course, like districts, the boundaries of these units are drawn by people and not truly natural.

Maryland’s districts unquestionably fail any test for compactness. I’m including maps here of four of the eight districts to do the artistry of the plan full justice:

CD2Maryland’s Second Congressional District

CD3Maryland’s Third Congressional District

CD4Maryland’s Fourth Congressional District

CD8Maryland’s Eighth Congressional District

Maryland’s eight districts had the lowest average compactness score of any in the nation, according to both the Dispersion and Perimeter measures.

All four of the above districts are contiguous but very thinly at some points. The 8th has a small link south of Laytonsville to connect the very Democratic southern Montgomery with heavily Republican areas in Frederick and Carroll in a manner that benefits Democrats.

In order to let Rep. Steny Hoyer in the 5th keep areas he desired in northwest Prince George’s around College Park, the 4th skirts narrowly around the edges of Prince George’s and Anne Arundel. This corridor connects heavily black and Democratic areas in Prince George’s to very Republican parts of Anne Arundel. The overall district is a black-majority Democratic seat.

Some have claimed that the 3rd in the least compact district in the country. It certainly gives others a run for their money, as it snakes around the State to take in parts of four counties and Baltimore City. Narrow corridors connect three discrete sections of Baltimore City and County.

The district then meanders west to take in a contiguous chunk of south Howard and northeast Montgomery before arcing through Anne Arundel. It has to jump across water to maintain contiguity with Annapolis and at other points. Apparently, Rep. Sarbanes wanted to keep representing that city.

I think the 2nd may be my personal favorite. Narrow corridors allow it to take in separate portions of Baltimore County before crawling up the coast to take in the most Democratic portions of Howard. It then wanders into Baltimore City and cuts across the harbor on its way to Anne Arundel.

It’s easy to ascribe the non-compact shapes to partisanship. However, the shapes stem even more from the desire to satisfy certain Democratic incumbents–primarily Cummings, Hoyer, Ruppersberger, and Sarbanes–from the look of the map.

Several of these incumbents live close to each other in the Baltimore area  even as population and political power has shifted away to other portions of the State. Baltimore City is now too small for even one congressional district. Yet it still has three.

In the next post, I examine why, just like among people, pretty isn’t always fair in redistricting.


Share