All posts by David Lublin

Turner-Valderrama-Sloan Form D26 Unity Slate

D26SlateDel. Kris Valderrama, Candidate David Sloan and Del. Veronica Turner

Del. Veronica Turner’s bid to unseat incumbent Sen. Anthony Muse just got a major shot in the arm. Together with Del. Kris Valderrama and David Sloan, Turner has formed the District 26 Unity Slate.

As I explained in my profile of the D26 Senate race, the alliance with Sloan had been rumored for awhile. Valderrama’s participation also does not shock. In 2010, Muse did not endorse Valderrama and then accused her of disseminating misleading information about him.

Like Turner, Valderrama is perceived as more progressive than Muse. Both Turner and Valderrama backed marriage equality despite Muse’s fierce opposition and criticism. Del. Jay Walker joined Muse in speaking at a tea-party organized rally against it.

Walker is supporting Tony Knotts for delegate so this seems a tacit rival to the formally announced D26 Unity Slate, as only three people can win election as delegate. I don’t know if Walker or Knotts are running with Muse. Though this would seemingly be the logical next step, the presence of five other candidates besides Valderrama and Sloan may complicate matters.

The District 26 Unity Slate held their first event on Monday at Mrs. Philippines Home and will hold their office opening on April 12th. The ticket works to the advantage of all the candidates as they benefit from mutual support and can multiply the impact of money and canvassing by working together. Of course, they also lend each other credibility in their campaigns.

Share

Rorschach Map of Incumbent Desires

Much has been made of the, ahem, “creative” boundaries of Maryland’s current congressional districts. A previous post provided more detailed maps that show the true artistry of the districts. But here is a statewide view that probably doesn’t do it full justice:

CDMDMaryland’s Current Congressional District Map

Many cite the non-compact boundaries as evidence of partisanship. Certainly, the 6th District was reconfigured to aid Democrats, who picked up the seat in 2012. However, Democrats did not have to draw these non-compact districts to gain a 7-1 majority in place of the previous 6-2 split. The following plan has seven districts that Obama won by 15% or more in 2008:

Obama15ptsAlternative Congressional Plan 1

While probably not the most compact plan that could be drawn, it also is clearly much more compact than the enacted plan. Beyond containing seven very Democratic districts, it also still contains two districts that are over 50% black in voting-age population.

A map that gave Democrats at least a 10% advantage in seven districts, again as measured by support for Obama in 2008, could be made even more compact and violate fewer county boundaries:

Obama10ptsAlternative Congressional District Plan 2

In this version, District 8 doesn’t reach the Pennsylvania border or take in any portion of Carroll County, which is no longer split. The Fourth District is also entirely within Prince George’s. Montgomery County has only two districts instead of three.

So why did the Democrats choose to adopt a plan with such meandering districts instead of a simpler version? According to many different sources, the answer lies in the desire to favor the preferences of certain incumbents, even when they were highly idiosyncratic and would not alter their reelection chances.

(1) Rep. Steny Hoyer insisted on continuing to represent UMD College Park, which he has represented since entering Congress. (Love the Turtle!) However, College Park is at the northwestern end of Prince George’s. Accommodating the desires of this powerful representative forced many other changes to plan.

For example, the 4th couldn’t continue to go into Montgomery if the 6th was to take in significant portions of that County, so the 4th now crawls around the edge of Prince George’s to enable it to scoop up Republican voters in Anne Arundel.

(2) Similarly, Rep. Dutch Ruppersberger sits on the intelligence committee and wanted to represent both Fort Meade and the Aberdeen Proving Ground. (Couldn’t we just buy him his own spy cam?) Even more creativity ensued as these two facilities lies at the opposite ends of the Baltimore region

(3) Rep. Elijah Cummings did not want to represent Carroll County, throwing yet another complication into the mix. Carroll is very Republican but would have easily been swamped by Cummings’ Baltimore base. So now Rep. Chris Van Hollen represents parts of Carroll County.

(4) Rep. John Sarbanes felt strongly that he wanted to continue to represent Annapolis, adding another layer of complexity into the plan’s requirements. Drafting a plan to satisfied this demand along with Ruppersberger’s helps explain how the 2nd and 3rd districts took on even more convoluted shapes.

(5) Complicating it all further was that so several representatives–Cummings, Harris, Ruppersberger, and Sarbanes–live with a small area near Baltimore. While living in the district is not required–just ask John Delaney–most prefer to do it.

And that’s how we ended up with this:

CD3

By the way, there is no legal impediment to gerrymandering for incumbents. Indeed, courts have cited it as a legitimate rationale for states to craft plans in a particular manner.

Share

MCEA Endorsements

The influential Montgomery County Educational Association has issued new endorsements for state legislative elections. So far, these choices are very conservative bets. They have endorsed all but one incumbent running for reelection.

In District 16, Susan Lee is also a lock for the Senate. All of the endorsed non-incumbent delegates are seen as having good chances, though the races in District 16 and 20 are the most up for grabs with other candidates having strong shots.

The only outstanding endorsement is in District 15 where recently appointed incumbent David Fraser-Hidalgo has not been endorsed. Rumor has it that they had planned to endorse challenger Bennett Rushkoff but that he did not receive the required super majority. We’ll see if MCEA picks Fraser-Hidalgo, Rushkoff, or no one.

Here is the current list with non-incumbents in boldface:

District 14
Senate: Karen Montgomery
Delegate: Anne Kaiser, Eric Luedtke and Craig Zucker

District 15
Senate: Brian Feldman
Delegate: Kathleen Dumais and Aruna Miller (one still pending)

District 16
Senate: Susan Lee
Delegate: Bill Frick, Ariana Kelly and Hrant Jamgochian

District 17
Senate: No Endorsement
Delegate: Kumar Barve, Jim Gilchrist and Andrew Platt

District 18
Senate: Rich Madaleno
Delegate: Al Carr, Ana Sol Gutiérrez and Jeff Waldstricher

District 19
Senate: Roger Manno
Delegate: Bonnie Cullison and Ben Kramer (no third endorsement)

District 20
Senate: Jamie Raskin
Delegate: Sheila Hixson, David Moon and Will Smith

District 39
Senate: Nancy King
Delegate: Charles Barkley, Kirill Reznick and Shane Robinson

Share

Thanks @MoCoYoungDems

I just wanted to thank the Montgomery County Young Democrats for having me over tonight. I had a blast meeting lots of people and sizing up the races. Oddly enough, I even got to feel young as the MCYDs are older than the students I taught earlier in the day.

Paraphrases of a few of the really good questions they asked: Will the state legislative delegation and county council get along better after the elections? Why isn’t there more competition in the County Council races? Which incumbent is most likely to lose the at-large races? Will the General Assembly take up legislation on GMOs soon? Will our delegation be more progressive after the election? How can our elected officials be more effective in Annapolis?

Kudos to Melissa Pinnick for taking the lead in organizing a MCYD team for the American Cancer Society Relay for Life in Rockville. Click to sign up for this event or make a donation in support of this event.

I’d say it was great to meet future leaders but this is an active and influential group. Almost all of them are already highly active in leadership roles around the County and the State.

They’re also smart. They found the secret entrance on Platform 2 1/2 of the Bethesda Metro Station to the B-CC Regional Services Center. Marc Korman and Jordan Cooper promised that, if elected, they’ll make it easier to find.

Share

All the Pretty Districts

In two posts yesterday, I argued that Maryland’s congressional redistricting plan is less outrageously biased to the Democrats than assumed by many despite its extremely non-compact lines. This post focuses on why pretty, compact lines may not produce plans that treat both parties fairly.

First, one can still gerrymander without necessarily producing especially non-compact shapes. In the 1980s, Arizona GOP adopted a plan that did not look particularly bad but still worked greatly to their benefit by packing Democrats into a single district.

The one Democratic district had a reasonably regular triangular shape. But it stretched across hundreds of miles of empty desert with its vertices being Yuma along with the especially Democratic sections of Phoenix and Tucson.

MD1990sCDsMaryland Congressional Plan 1992-2000

The Maryland plan used from 1992 through 2000 may not have been as compact as possible but was much more so than the current plan. Though drafted by Democrats, it didn’t work very well for them in the 2000 elections.

MD2000CDelection2000 Maryland Congressional Results

The Democrats won by more than 200,000 votes, or 11%, but still only won 50% of the eight seats. Usually, though by no means always, a clear win in votes will give the majority party more than its fair share of seats.

As this example demonstrates, the outcome in single-member district electoral systems depends heavily upon how the votes are distributed. Parties lose out when they supporters are not efficiently spread across the state.

Parties whose voters are too packed–that is, over concentrated–into a few districts will win those districts by wide margins but forgo opportunities to gain neighboring districts. On the other hand, parties with supporters spread too thinly risk winning no seats even if they receive many votes. In winner-take-all elections, there is no prize for second place.

The distribution of voters often has a major impact on election outcomes even if constituency boundaries are drawn by excellent nonpartisan procedures. The United Kingdom has nonpartisan boundary commissions draw their maps. Yet they hardly treat the two largest parties equally.

Between 1979 and 1992, the Conservatives won four straight elections with between 42% and 44% of the vote. Their majorities varying greatly in size, ranging from 52% to 61% of parliamentary seats. They performed at their best in 1983 when the second and third place parties nearly tied, leaving the Conservatives ahead in more seats than other years.

Labour won 41% to 43% of the vote in 1997 and 2001 but gained more substantial majorities–62% to 63% of all seats–than the Conservatives did with about the same vote share. In 2005, Labour even gained a majority of 55% of seats with just 35% of the vote, the lowest share in British history. However, the Conservatives gained only a minority in 2010 with 36% of the vote.

The key lesson is that maps with compact districts and regular lines do not necessarily produce unbiased outcomes that reward parties with an equal number of seats for the same share of votes. The distribution of voters is critical.

Next up: competitiveness, responsiveness and redistricting.

Share

Compactness in Redistricting

When people refer to geographical compactness, they refer to districts of sensible shape. Why does this matter? First, odd shapes can indicate gerrymandering. Second, the idea of single-member districts is grounded in the representation of territorially organized communities where each area has its representative, though many dispute this idea of community.

One common compactness measure, usually referenced as the Reock or Dispersion measure, is the ratio of the area of a district to the area of the smallest circle that can enclose the district:

Reock

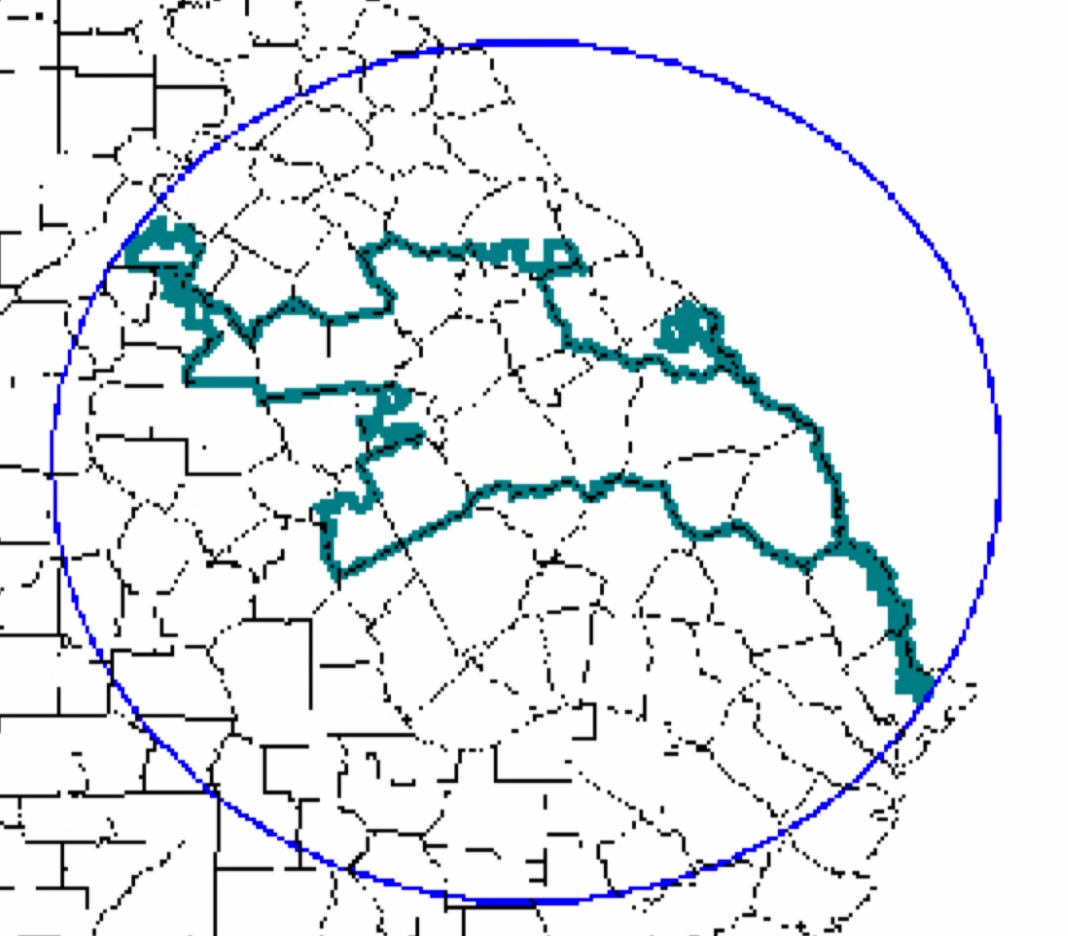
Reock or Dispersion Measure of Compactness

The idea behind the measure is that a circle is the most compact shape, so it compares the district to the smallest circle that can encompass it. As the name indicates, it is viewed as a good measure of the dispersion of the area of a district.

Another widely used compactness measure is the ratio of the area of a district to the area of a circle with the same perimeter as the district (the Polsby-Popper or Perimeter measure):

Polsby-Popper

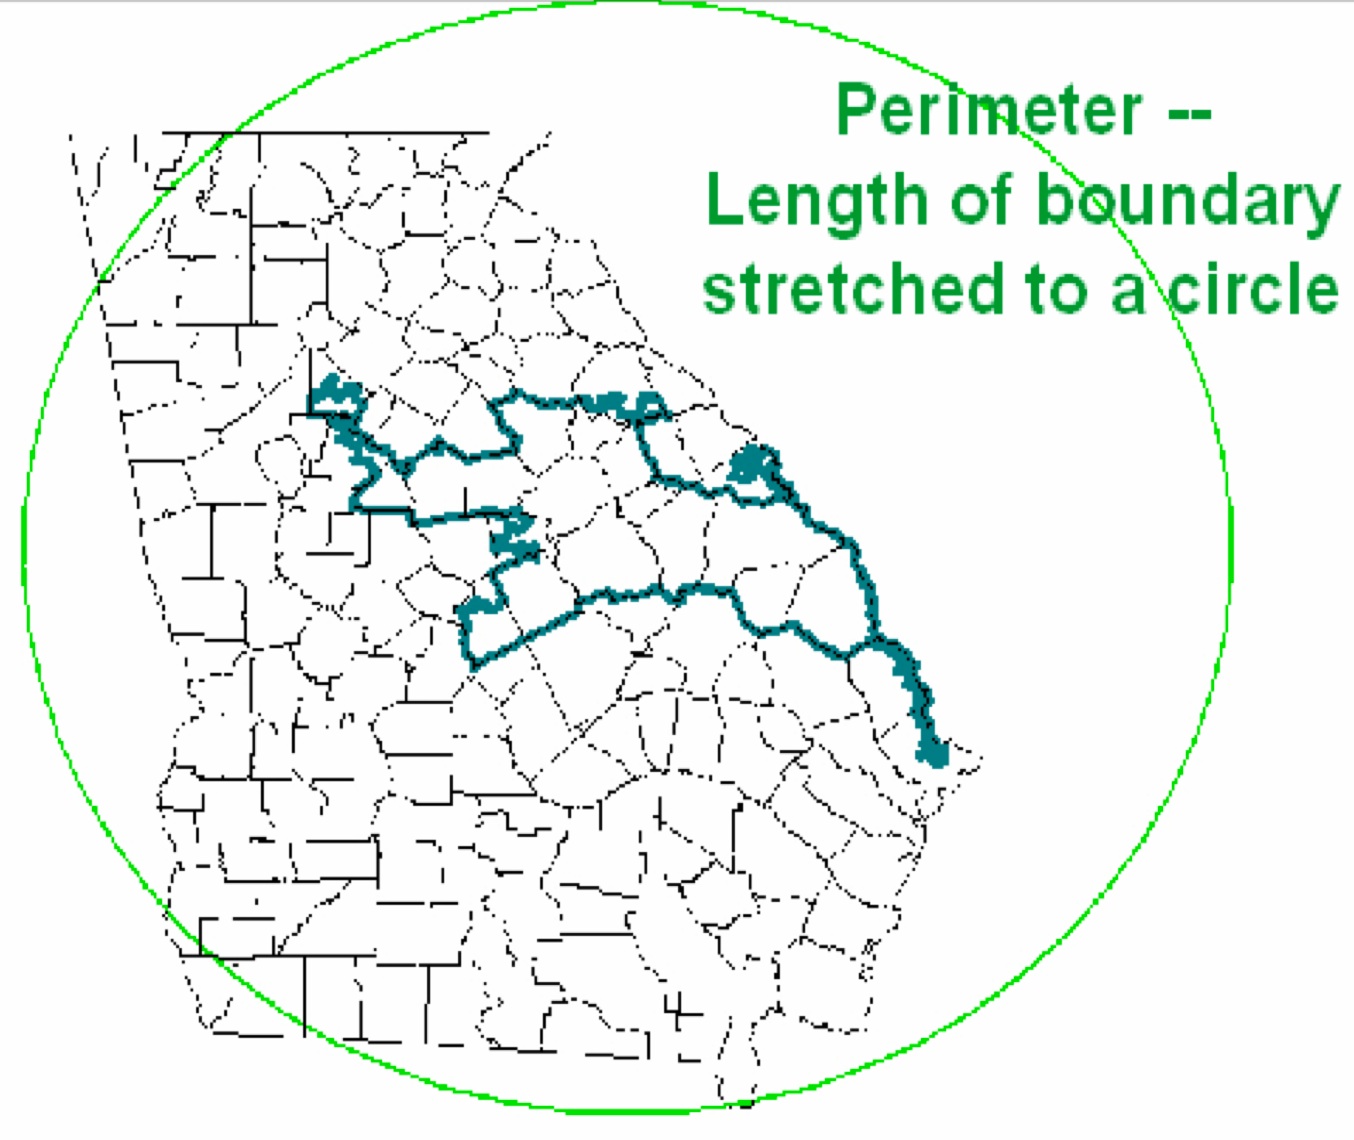
Polsby-Popper or Perimeter Measure

This measure tends to give low (i.e. worse) scores to districts with many crinkles in their boundaries and that are elongated in ways that stretch their boundaries but encompass little territory. In contrast, districts with smooth boundaries that maximize the area enclosed score well.

Complaints about both measures include that one cannot draw only circular districts and that state boundaries are not circular. For this reason, it is important to compare district scores to other districts and especially other plans for districts in the same state.

A final compactness measure is the Grofman Interocular Test. Developed by my humorous friend and sometime coauthor, Bernie Grofman, it’s his way of asking does “evidence of gerrymandering leap up and hit you in the eyeballs.” Rather like Justice Stewart said about pornography, gerrymandeirng can be hard to define but you know it when you see it.

Closely related to compactness are the ideas of contiguity and adherence to administrative boundaries. Contiguity is simply that one could, at least in theory, travel from any point in a district to any other point without leaving the district. A stricter version might require that one can travel in practice without having to cross into another district.

Federal law now requires that congressional districts be contiguous in the looser sense. In recent times, some districts have stretched the principle thinly with point contiguity, which is when districts remain connected at just one point.

Others value adherence to administrative boundaries, such as county and municipal lines, as helping preserve natural communities of interest. Of course, like districts, the boundaries of these units are drawn by people and not truly natural.

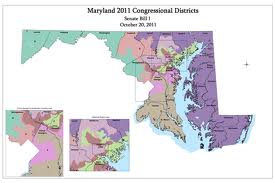
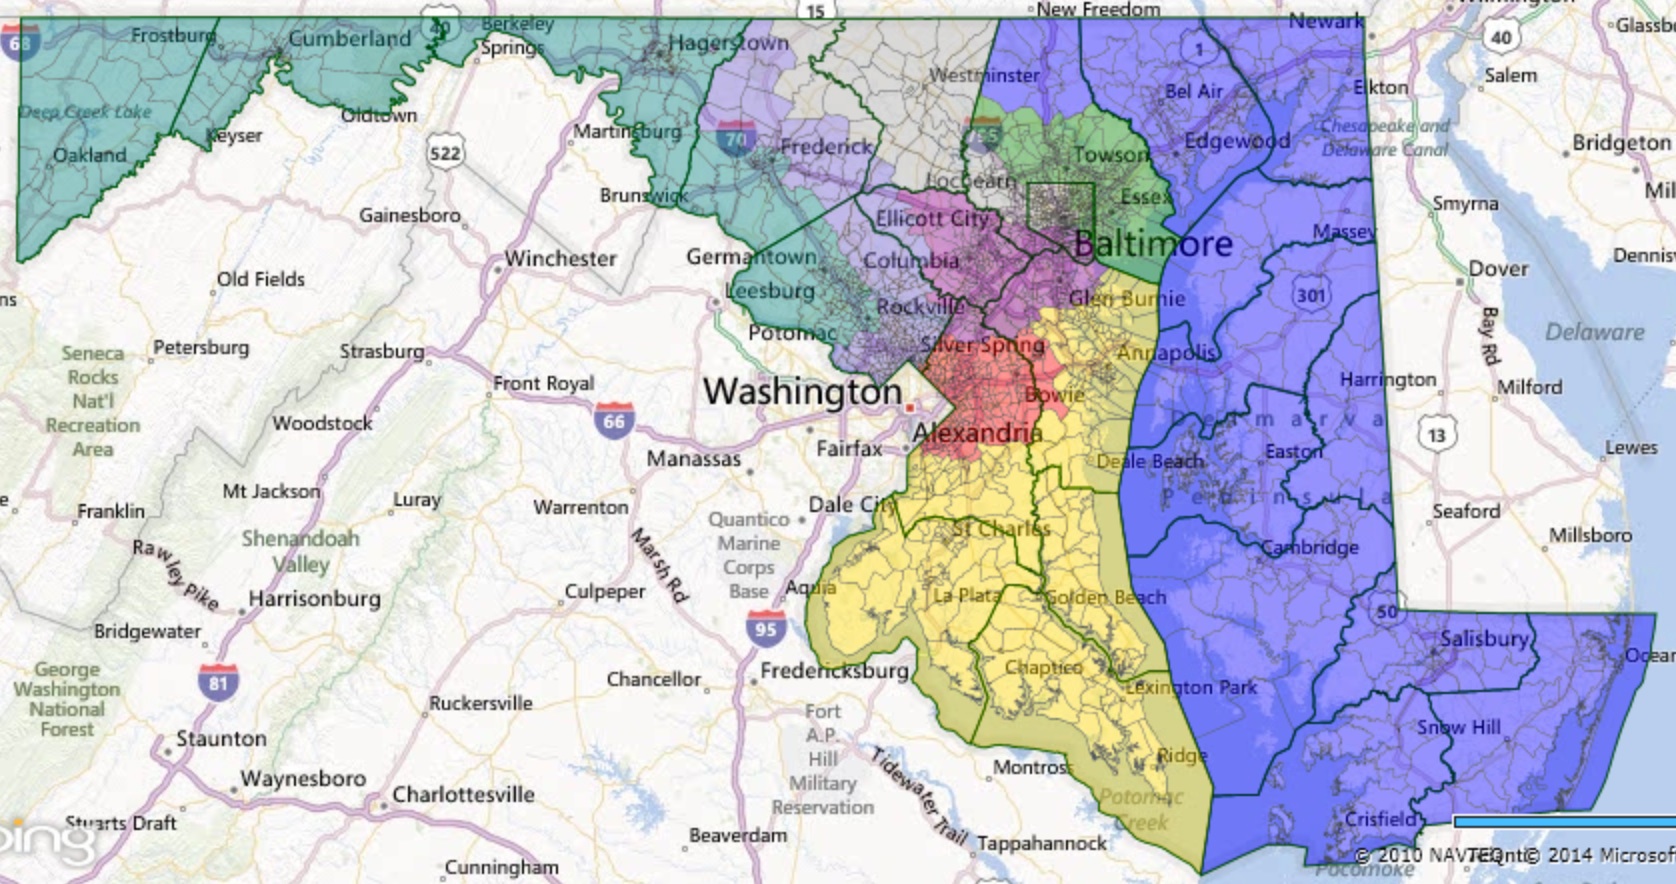
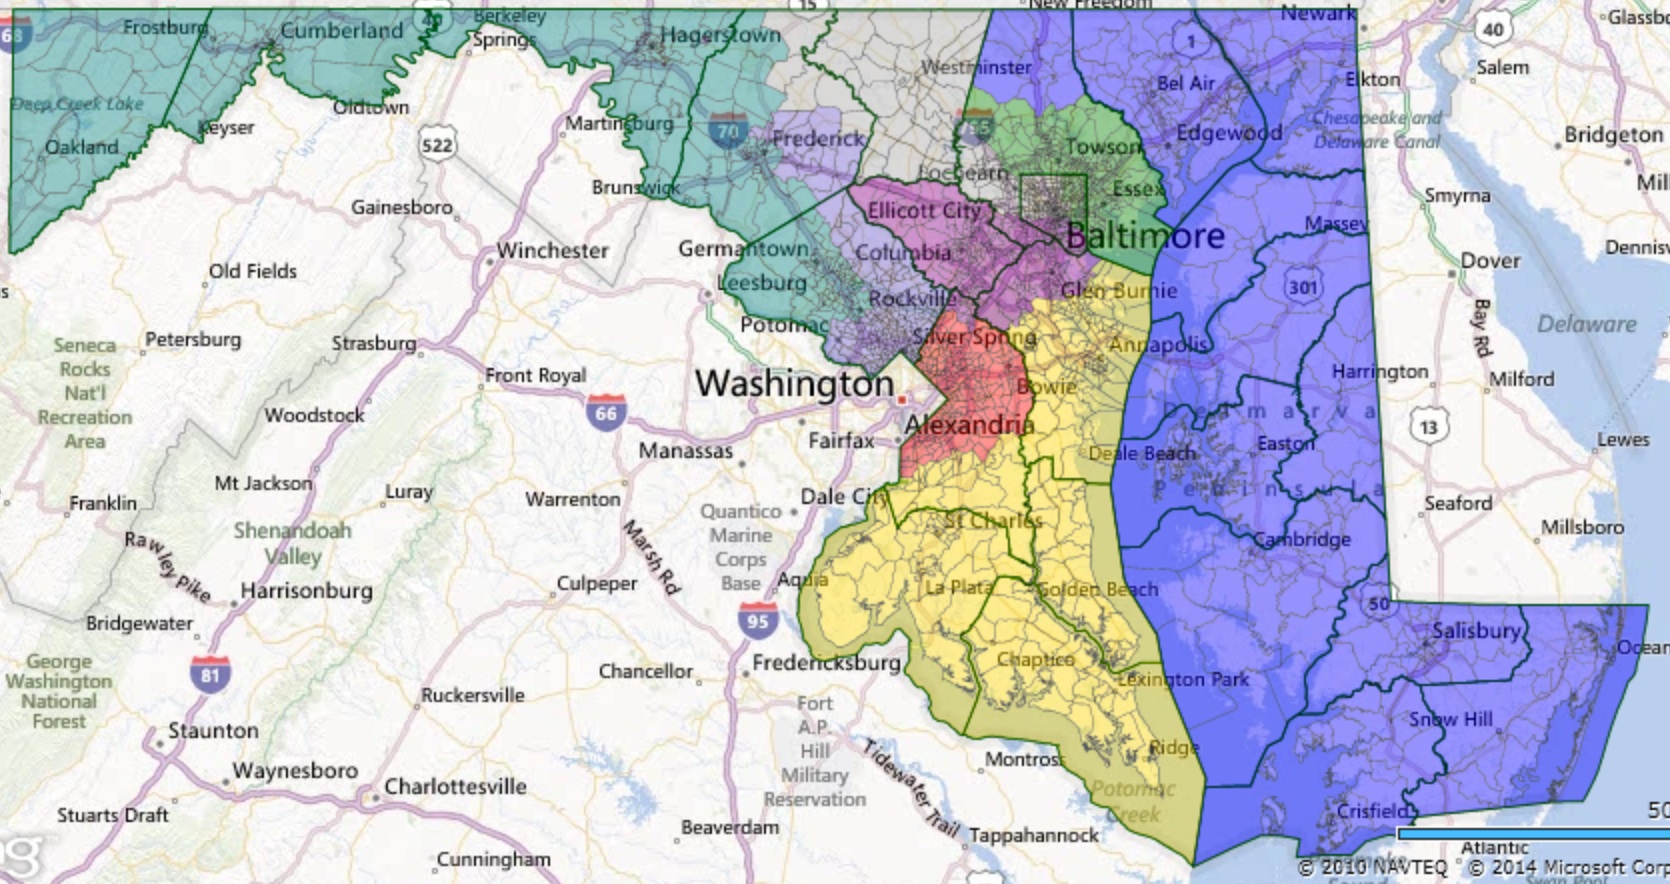
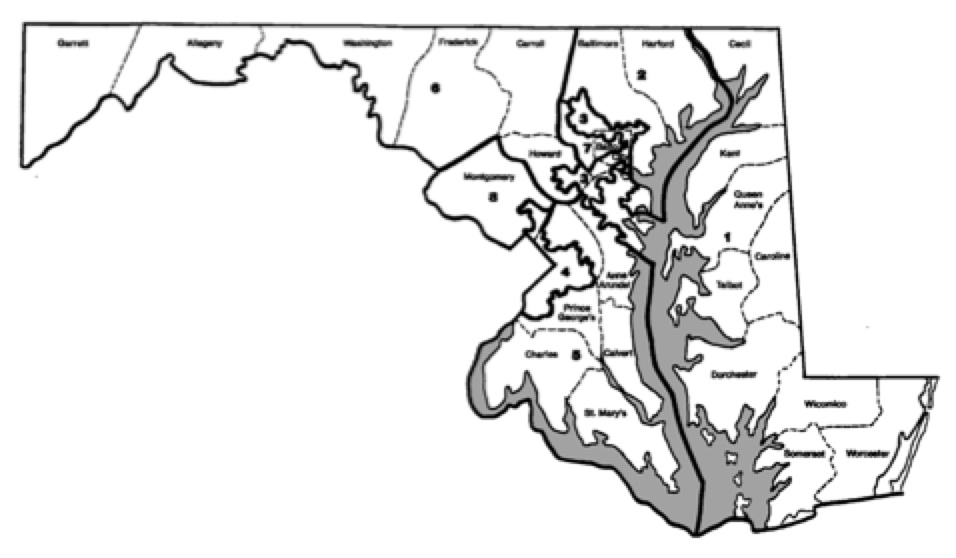
Maryland’s districts unquestionably fail any test for compactness. I’m including maps here of four of the eight districts to do the artistry of the plan full justice:

CD2
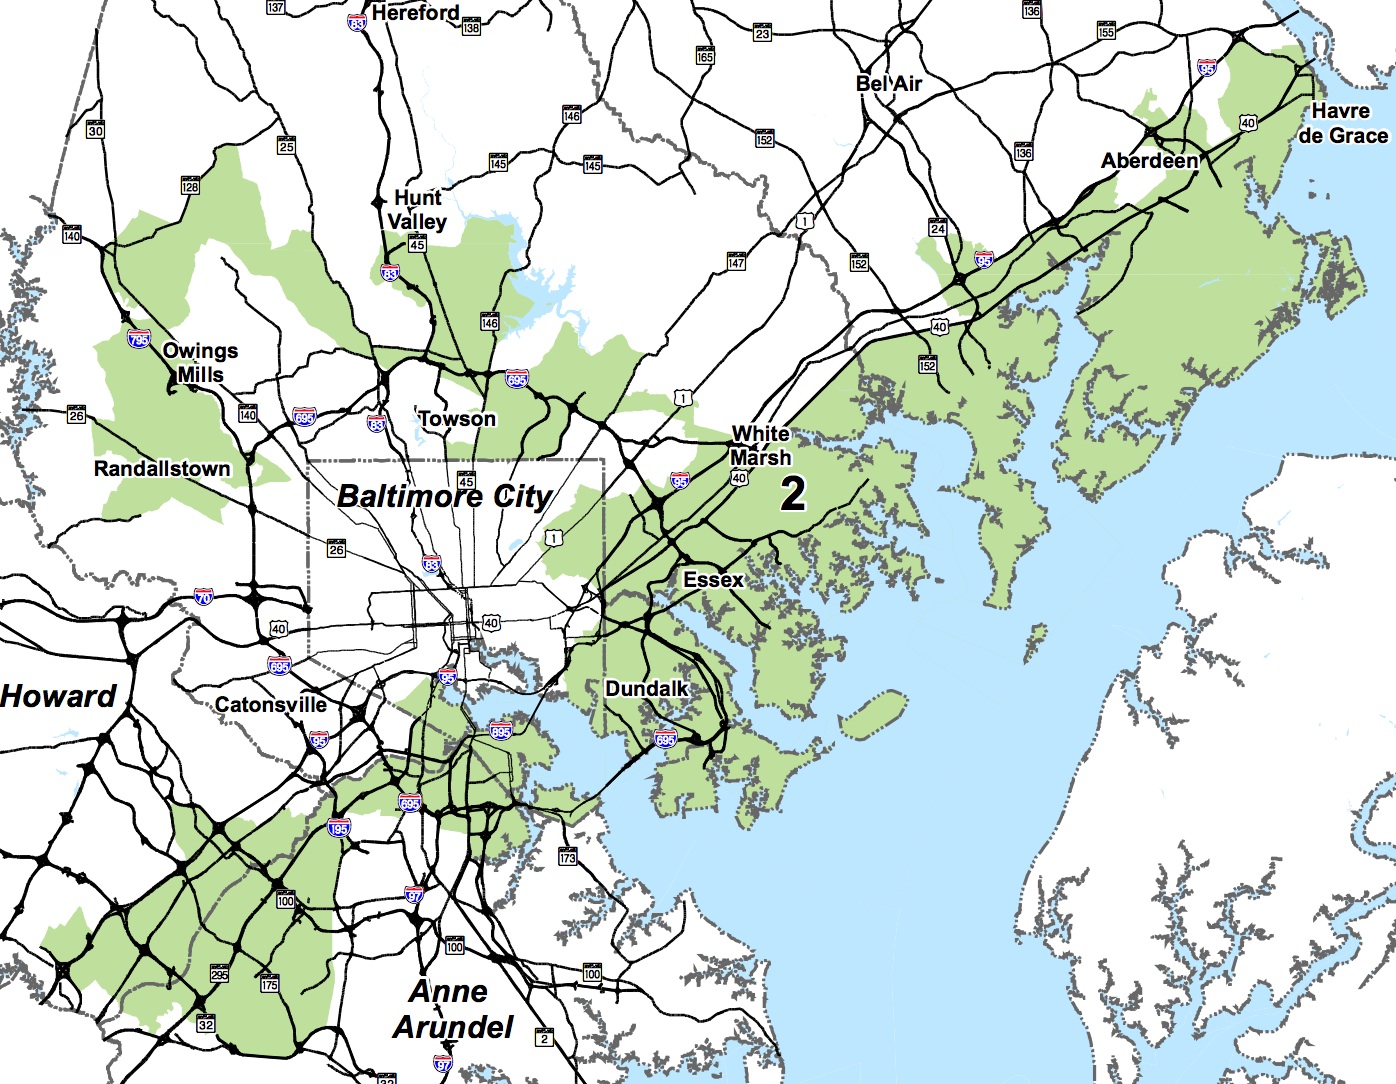
Maryland’s Second Congressional District

CD3
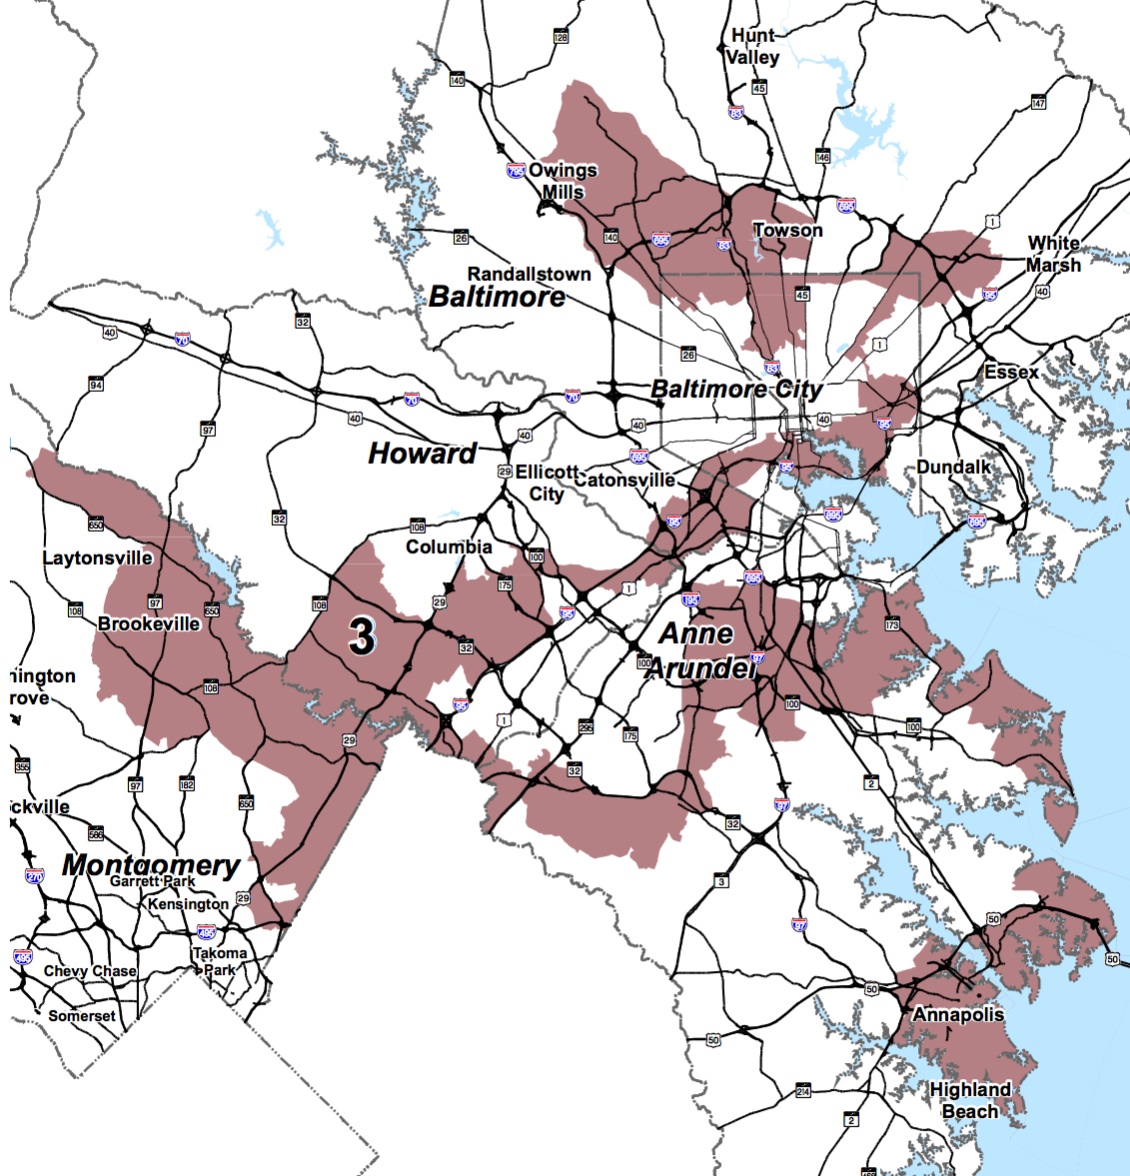
Maryland’s Third Congressional District

CD4
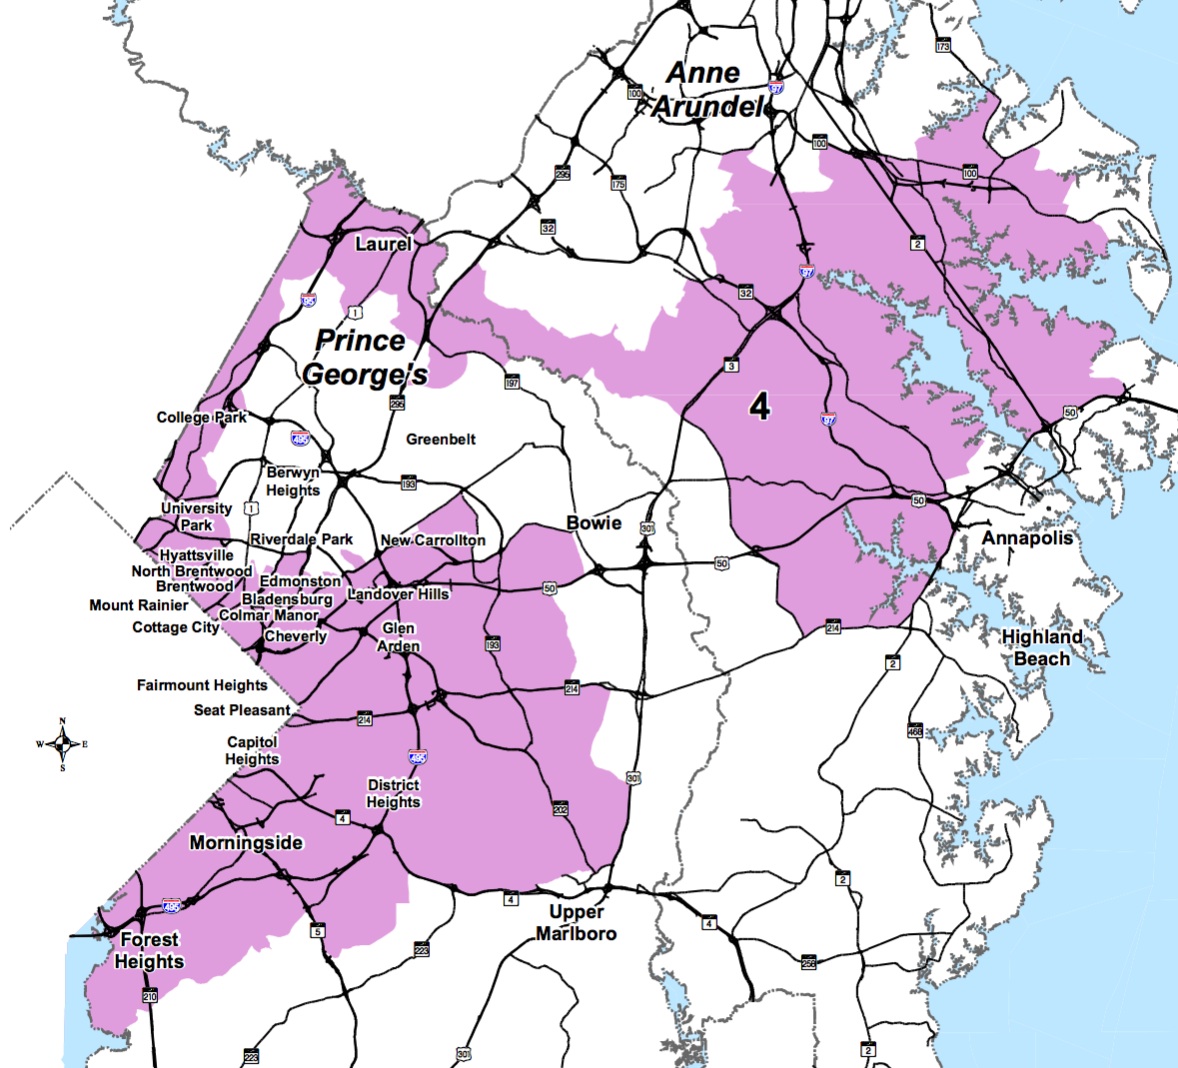
Maryland’s Fourth Congressional District

CD8
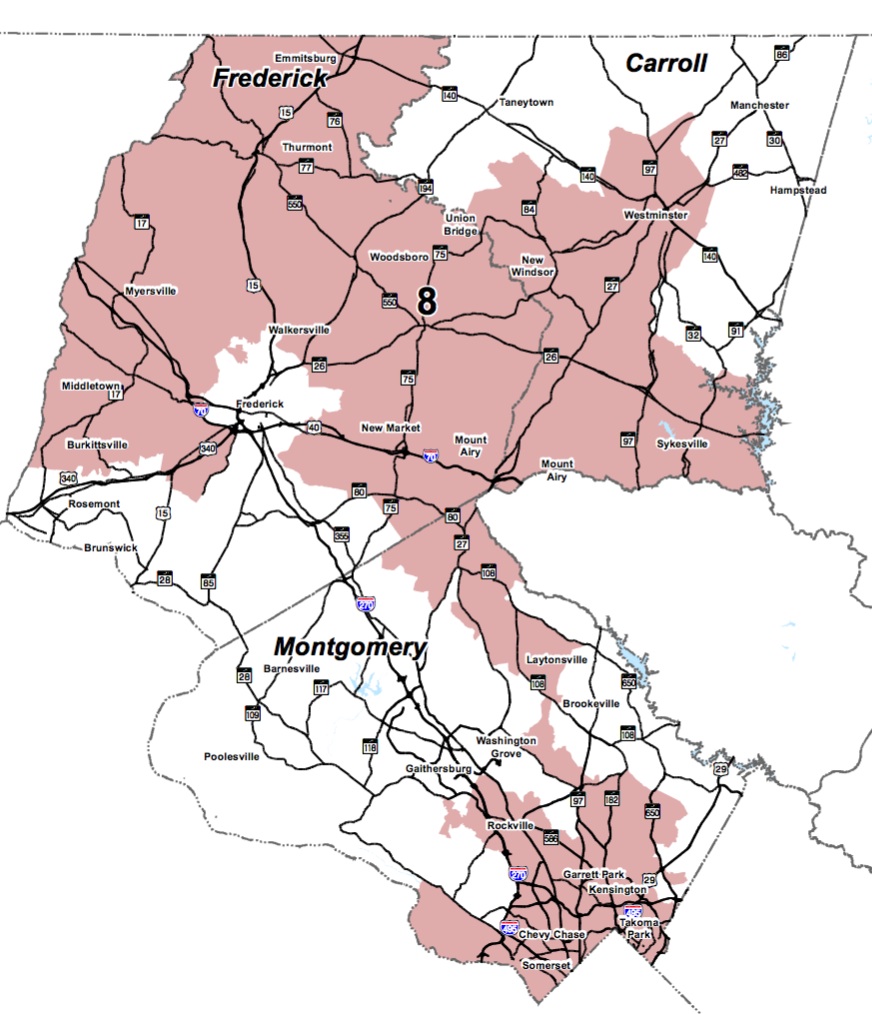
Maryland’s Eighth Congressional District

Maryland’s eight districts had the lowest average compactness score of any in the nation, according to both the Dispersion and Perimeter measures.

All four of the above districts are contiguous but very thinly at some points. The 8th has a small link south of Laytonsville to connect the very Democratic southern Montgomery with heavily Republican areas in Frederick and Carroll in a manner that benefits Democrats.

In order to let Rep. Steny Hoyer in the 5th keep areas he desired in northwest Prince George’s around College Park, the 4th skirts narrowly around the edges of Prince George’s and Anne Arundel. This corridor connects heavily black and Democratic areas in Prince George’s to very Republican parts of Anne Arundel. The overall district is a black-majority Democratic seat.

Some have claimed that the 3rd in the least compact district in the country. It certainly gives others a run for their money, as it snakes around the State to take in parts of four counties and Baltimore City. Narrow corridors connect three discrete sections of Baltimore City and County.

The district then meanders west to take in a contiguous chunk of south Howard and northeast Montgomery before arcing through Anne Arundel. It has to jump across water to maintain contiguity with Annapolis and at other points. Apparently, Rep. Sarbanes wanted to keep representing that city.

I think the 2nd may be my personal favorite. Narrow corridors allow it to take in separate portions of Baltimore County before crawling up the coast to take in the most Democratic portions of Howard. It then wanders into Baltimore City and cuts across the harbor on its way to Anne Arundel.

It’s easy to ascribe the non-compact shapes to partisanship. However, the shapes stem even more from the desire to satisfy certain Democratic incumbents–primarily Cummings, Hoyer, Ruppersberger, and Sarbanes–from the look of the map.

Several of these incumbents live close to each other in the Baltimore area  even as population and political power has shifted away to other portions of the State. Baltimore City is now too small for even one congressional district. Yet it still has three.

In the next post, I examine why, just like among people, pretty isn’t always fair in redistricting.


Share

Congressional Plan Fairer Than You Think

CDMD2012 Congressional District Map

Redistricting remains one of the more contentious if arcane subjects in American politics. Unlike in many other western democracies with single-member district elections, such as Australia, Canada and the United Kingdom, the U.S. still usually allows politicians to draw both congressional and state legislative districts.

Some advocate that states ought to construct plans that are fair to Democrats and Republicans. And Maryland’s congressional plan has been attacked as unfair to Republicans not only by the GOP but by other observers, such as St. Mary’s College Professor Todd Eberly.

But how do you measure partisan fairness? Here are two basic principles that some see as underlining a fair plan that does not favor one party over the other along with an assessment of how well Maryland’s current plan lives up to them:

(1) No Partisan Bias. This principle is the simple idea that a party should win 50% of the seats if it wins 50% of the votes. Note that this is not the same as proportionality–that a party wins the same share of seats as votes.

There are different ways of testing for partisan bias. Examining the vote of statewide candidates in different districts is one simple way to test plans (not necessarily the best but easy to comprehend). The advantage of statewide candidates is that one can assess party performance with the same two candidates across all districts.

In this example, I use the presidential race. As is well known, Obama carried seven of the eight current districts in 2008. The two-party vote in each congressional district is shown in the first two columns:

BiasMD

Obama’s average vote share was 63.1%. But what if there was a uniform swing across all district of 13.1% towards McCain? Under this scenario, Obama and McCain would each have averaged 50.0% of the vote (see columns 3 and 4). Interestingly, each would also have carried four districts–exactly 50% of the total.

So the current plan passes a simple and cursory bias test. When each party receives 50% of the vote, each should win 4 districts.

(2) Symmetry reflects that if one party gains 65% of the seats with 55% of the votes, so should the other party. In single-member plurality elections, a party often gains a seat bonus when it wins more than a majority. This principle encapsulates the idea that such a bonus should be symmetrical and equal for both parties.

How symmetrical in Maryland’s plan? Again, examining the presidential vote is illuminating. In the example, below I envision a uniform swing across districts to estimate how many districts McCain would have won if he had received 63.1%–the share Obama actually won in the election.

SymmetryMD

The table suggests that McCain would have carried six districts–one less than Obama carried with the same share of the vote. So the plan is not perfectly symmetrical. The two black-majority districts (4 and 7) contain so many Democratic voters that even a Republican tsunami would not turn them blue, though the 7th comes close.

Examining the data in the table closely further suggests that Republicans would need only an additional 2.5% of the vote to carry all eight districts. However, Democrats would not achieve the same feat if they received the same vote share.

In truth, it can be very hard to construct plans free of bias and perfectly symmetrical. Moreover, swings are rarely uniform and the geographical concentration of partisans can shift over time. Of course, that also doesn’t mean we can’t often do better.

This at-first-glance examination also indicates that moaning about the partisan unfairness of the plan is not necessarily justified even though the plan was crafted by Democrats and one assumes designed to achieve their ends.

Complaints about the plan probably need to focus more on other issues. Next, I examine compactness–one of the major criticisms of Maryland’s redistricting plan.

Share

Push Polls in District 20?

MoonSmithShurbergThree of the District 20 Delegate Candidates: David Moon, Will Smith, and Jonathan Shurberg

District 20 has a lively delegate race with two vacancies caused by Del. Heather Mizeur’s gubernatorial run and Del. Tom Hucker’s county council candidacy. Local lawyer and Democratic activist Jonathan Shurberg is a candidate.

Jon has already loaned his campaign $125K and is rumored to be prepared to loan far more if needed to win the seat in his first run for elective office. Even in Montgomery County, he will clearly break towards the very high end of spending if he follows through and loans his campaign similar amounts in the future.

Rumors started earlier this week that Jon was the victim of a push poll when voters started receiving calls asking questions about Shurberg’s past three tax liens and previous disbarment, actually suspension, from the practice of law in Maryland (see also here and here) due to having misappropriated client funds. The poll also asked for responses to positive statements about his opponents.

Some speculated that David Moon or Will Smith–two other candidates in the race–had possibly sponsored the poll to undermine Jon’s campaign. Both know quite a bit about campaigns, especially in District 20. David ran Jamie Raskin’s 2006 campaign, has worked extensively as a campaign consultant, and is the author of the Maryland Juice blog, Will Smith, a former Obama appointee in the Department of Homeland Security, ran the D20 slate’s successful reelection campaign in 2010.

However, I could not imagine savvy, experienced campaign consultants like either David or Will carrying out a push poll because it just wouldn’t make much sense in this case.

First, the multi-seat nature of delegate races offers little incentive to go negative. When campaigning in these sorts of races, it’s best to be on friendly terms with everyone. If you meet a voter who says they like a rival candidate, it makes it easier to respond “she’s great, I hope you’ll vote for me too!” Attacking another candidate mainly risks losing votes from their supporters.

Second, there is no guarantee that it will benefit the ad’s sponsor, particularly in a race with so many candidates. Instead, it may aid another candidate, especially when the target denounces the ad as scurrilous and its sponsor as throwing mud. Finally, polling is costly and the money would be better spent on voter contact.

So who did the poll?

Turns out Jon did the poll to test out the impact of potential attacks and positive messages that other candidates may use.

Not a good use of campaign funds. Money is a very helpful campaign resource but only if it is spent wisely. Polling results are often dubious in down ballot races with so many candidates. Name recognition of the candidates is low. Voters respond as much to cues from endorsers as much as message.

One can test messages but it hardly requires a poll to know that voters will be suspicious of an attorney threatened with disbarment. Moreover, it’s working to counter a message that will likely never be used. Better to have spent the money on voter contact instead of exposing voters to negative information about his past.

Share

#ABrowning #Ganslering and #Mizeuring ?

I admit it’s hard to outdo #McConnelling as the star looks like he is straight out of central casting for Yertle the Turtle. But the way to really do this meme to death is to take it local. If anyone is up for the challenge, you can find the first ads for the Doug Gansler and Anthony Brown campaigns on this site. If Heather Mizeur has a good video, someone please send it this way, so she can play too. Videos of Republican candidates are, of course, also welcome. I’ll consider showing the results here (note: must adhere to the rules of clean campaigning entirely as interpreted by me).

Share