Tag Archives: 2018 Precinct Results

Trump vs Hogan: Votes by MoCo Town

By Adam Pagnucco.

In what amounts to an early Christmas for this number cruncher, the State Board of Elections has released precinct voting data for candidate races and ballot questions. We are going to have a lot more of this in coming days, but here is a very quick cut comparing outgoing (yes, outgoing) President Donald Trump with Governor Larry Hogan.

In the 2020 general election, Trump received 19% of the vote in MoCo. In the 2018 general election, Hogan received 44% of the vote in MoCo, probably the highest percentage for a Republican in a MoCo gubernatorial general since Spiro Agnew won the county in 1966.

In comparing the two, there are two caveats. First, the electorate in the 2020 general election (more than 517,000 voters in MoCo) was bigger than the electorate in the 2018 general election (413,137). That means these are different groups of voters, although the Democratic percentage of the electorate in 2020 (64%) is about the same as in 2018 (65%). (The state has not released official turnout numbers yet for 2020, making these numbers approximate.)

Second, 2020 precinct level data includes all voting modes whereas 2018 included election day votes only. Election day votes accounted for 61% of all MoCo votes cast in the 2018 general election, and the Democratic percentage of the electorate (61%) was lower than the Democratic percentage of other voting modes (71%). That skews the 2018 precinct results in Hogan’s favor a bit. Hogan won 47% of MoCo’s election day votes whereas he won 44% of MoCo’s general election votes overall.

All of the above said, the chart below shows Trump’s vote percentage by MoCo town in the 2020 general election.

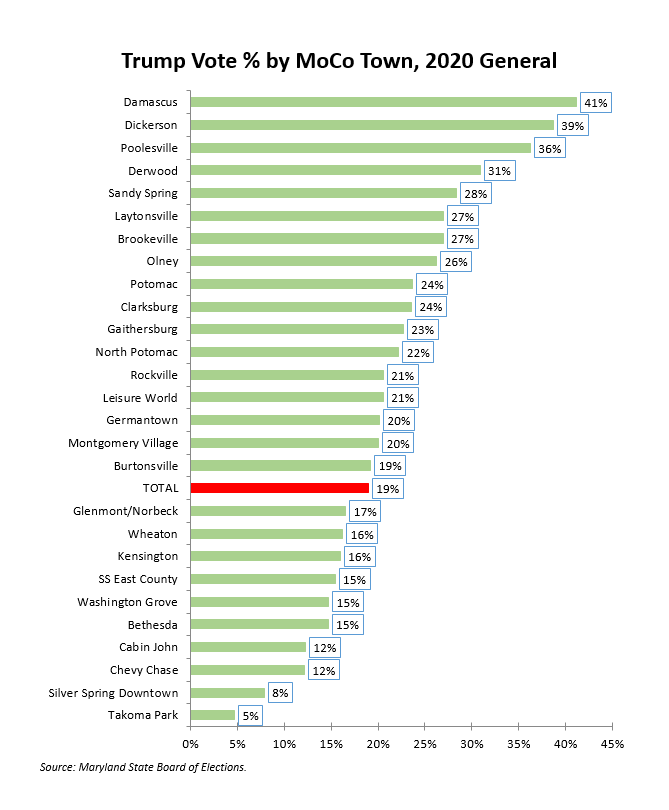
These results are predictable. Trump only won one precinct out of MoCo’s 258 precincts: 12-1 in Damascus, where he tallied 962 votes vs Joe Biden’s 926. Trump did particularly badly in the Democratic Crescent, pulling in the teens and single digits there.

The chart below shows Hogan’s election day vote percentage by MoCo town in the 2018 general election.

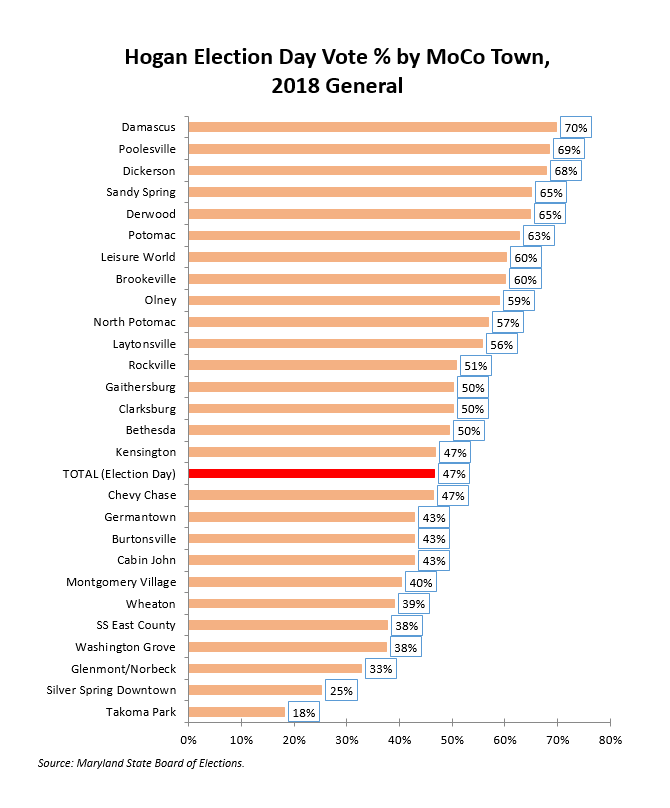
In terms of election day votes only, Hogan won many areas in MoCo. Even if other voting modes were included, Hogan probably won in Brookeville, Damascus, Derwood, Dickerson, Laytonsville, Leisure World, North Potomac, Olney, Poolesville, Potomac and Sandy Spring. Hogan’s overall loss in MoCo was due to lopsided defeats in Silver Spring and Takoma Park, not to geographically broad unpopularity.

This goes to show that a fiscally conservative, socially agnostic and politically strategic Republican can get a lot of votes here, especially in upcounty. But Trumpism is a huge loser in MoCo.

Share

MoCo Democratic Turnout: Precinct Results

By Adam Pagnucco.

Data Christmas has arrived as precinct results from the primary are now available from the State Board of Elections! We have been busy crunching them and will now begin rolling them out for our beloved readers.  Let’s start today with turnout among MoCo Democrats.

Overall, MoCo Democratic turnout was 35% in the 2018 primary, higher than the state average of 29%.  MoCo ranked second to Talbot County among the state’s 24 jurisdictions on this measure.  MoCo’s rate of 35% was higher than it was in 2010 and 2014 (26% each time) but lower than 2006 (40%) and 2002 (45%).  Still, being second in the state after being in the middle of the pack in the last two gubernatorial cycles is a good thing for MoCo.

Looking inside the county, there were vast differences in Democratic turnout between local areas.  Here are the five highest rates and the five lowest.

Highest Democratic Turnout Rates

Leisure World: 52%

Chevy Chase: 49%

Cabin John: 47%

Kensington: 45%

Takoma Park and Bethesda: 44%

Lowest Democratic Turnout Rates

Burtonsville and Damascus: 28%

Montgomery Village: 27%

Clarksburg: 27%

Germantown: 26%

Glenmont/Norbeck: 24%

These differences were reflected in state legislative and council districts.  Council District 1 led with 45% while Council District 2 was last with 28%.  State Legislative District 16 led with 44% while District 39 was last with 26%.  In the Democratic Crescent – the areas inside and near the Beltway that sent Jamie Raskin to Congress – turnout was 44%.  That compares to turnout rates of 29% in Upcounty and 34% in the rest of the county.

In precincts where support for term limits in 2016 was less than 65%, turnout was 42%.  In precincts where support for term limits was more than 80%, turnout was 31%.  This suggests confirmation of a post we wrote before the primary: Democrats who voted for term limits were less likely to vote in the primary.

Another factor that stands out is the differences among precincts based on their racial composition.  We have been matching precincts to racial data from Census tracts since the 2006 cycle.  (We have redone this numerous times since then to accommodate the 2010 Census and shifting precinct borders.)  Among majority white precincts, Democratic turnout was 41% and turnout rose as white percentage increased.  Among “majority minority” precincts, Democratic turnout was 29% and that rate fell as the white percentage declined.  Precincts that were more than 33% Latino had a combined turnout rate of 26%.

We show the full splits below.

These patterns of higher turnout in white areas, wealthy areas and the Democratic Crescent and lower turnout in Upcounty, areas with lots of people of color and lower income areas had a powerful impact on the races for Governor, County Executive and County Council At-Large.  We will begin looking at those races soon.

Share