
By Adam Pagnucco.
Data Christmas has arrived as precinct results from the primary are now available from the State Board of Elections! We have been busy crunching them and will now begin rolling them out for our beloved readers. Let’s start today with turnout among MoCo Democrats.
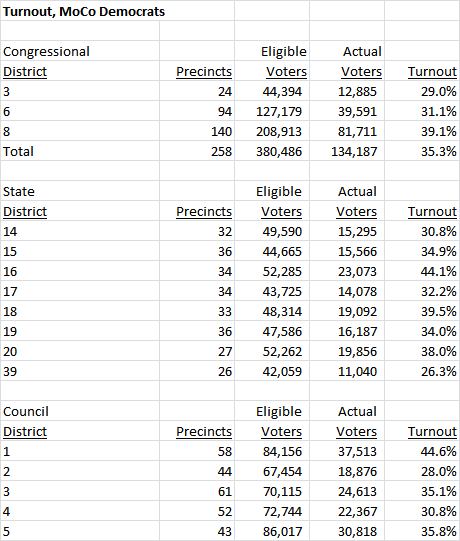
Overall, MoCo Democratic turnout was 35% in the 2018 primary, higher than the state average of 29%. MoCo ranked second to Talbot County among the state’s 24 jurisdictions on this measure. MoCo’s rate of 35% was higher than it was in 2010 and 2014 (26% each time) but lower than 2006 (40%) and 2002 (45%). Still, being second in the state after being in the middle of the pack in the last two gubernatorial cycles is a good thing for MoCo.
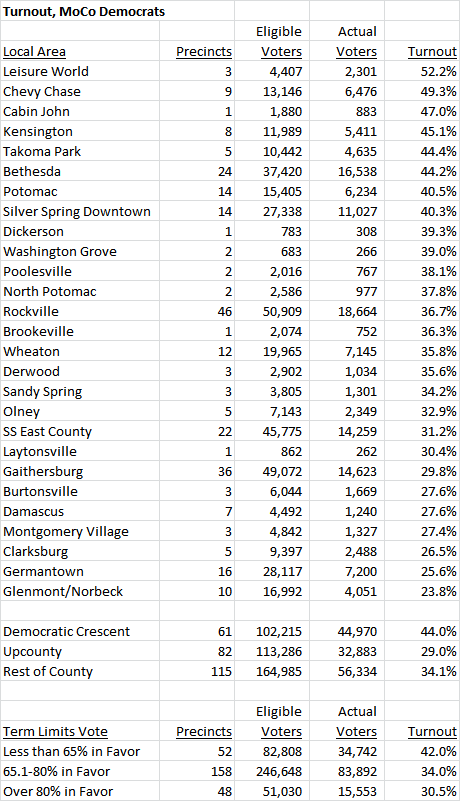
Looking inside the county, there were vast differences in Democratic turnout between local areas. Here are the five highest rates and the five lowest.
Highest Democratic Turnout Rates
Leisure World: 52%
Chevy Chase: 49%
Cabin John: 47%
Kensington: 45%
Takoma Park and Bethesda: 44%
Lowest Democratic Turnout Rates
Burtonsville and Damascus: 28%
Montgomery Village: 27%
Clarksburg: 27%
Germantown: 26%
Glenmont/Norbeck: 24%
These differences were reflected in state legislative and council districts. Council District 1 led with 45% while Council District 2 was last with 28%. State Legislative District 16 led with 44% while District 39 was last with 26%. In the Democratic Crescent – the areas inside and near the Beltway that sent Jamie Raskin to Congress – turnout was 44%. That compares to turnout rates of 29% in Upcounty and 34% in the rest of the county.
In precincts where support for term limits in 2016 was less than 65%, turnout was 42%. In precincts where support for term limits was more than 80%, turnout was 31%. This suggests confirmation of a post we wrote before the primary: Democrats who voted for term limits were less likely to vote in the primary.
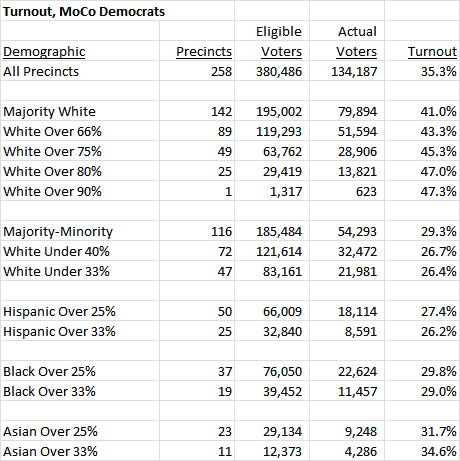
Another factor that stands out is the differences among precincts based on their racial composition. We have been matching precincts to racial data from Census tracts since the 2006 cycle. (We have redone this numerous times since then to accommodate the 2010 Census and shifting precinct borders.) Among majority white precincts, Democratic turnout was 41% and turnout rose as white percentage increased. Among “majority minority” precincts, Democratic turnout was 29% and that rate fell as the white percentage declined. Precincts that were more than 33% Latino had a combined turnout rate of 26%.
We show the full splits below.
These patterns of higher turnout in white areas, wealthy areas and the Democratic Crescent and lower turnout in Upcounty, areas with lots of people of color and lower income areas had a powerful impact on the races for Governor, County Executive and County Council At-Large. We will begin looking at those races soon.
