Tag Archives: Pandemic Wages Series

Why Are Average Wages Increasing During the Pandemic? Part Four

By Adam Pagnucco.

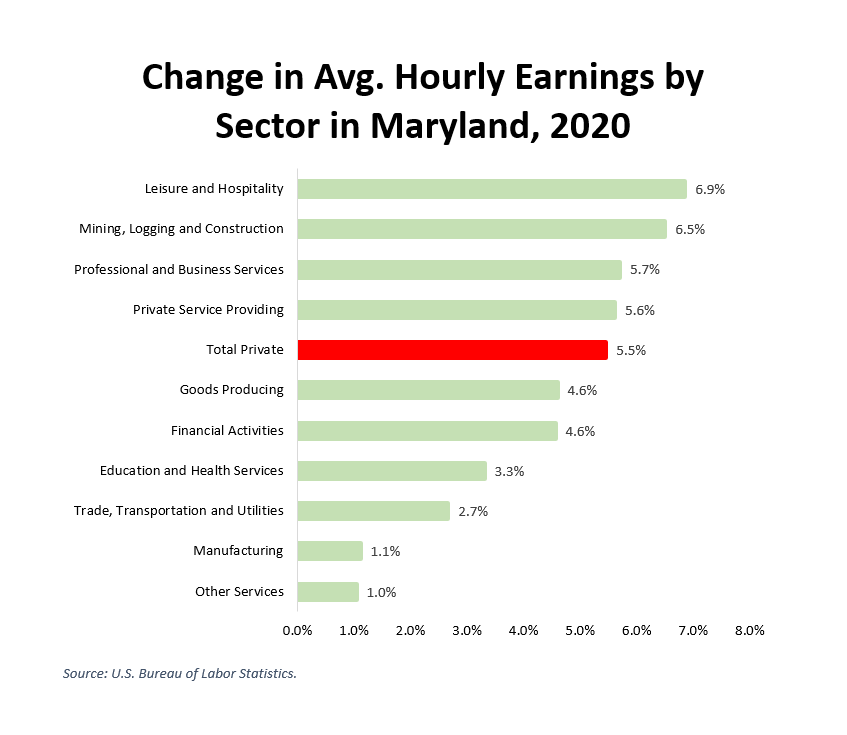
In Part Three, we learned that rising average wages during the pandemic are likely a sign of growing income inequality as job losses are concentrated in lower paying positions. Preliminary data from the U.S. Bureau of Labor Statistics (BLS) suggests how this is playing out across Maryland.

BLS’s county employment series has a six-month lag in release time. As of this writing, county-level data are only available through the second quarter of 2020. However, BLS also has a state and metro area series that is more up to date. Preliminary data for that series is currently available through the end of 2020. BLS releases that data for metropolitan statistical areas in Maryland defined as follows:

Baltimore-Columbia-Towson: Anne Arundel, Baltimore City, Baltimore County, Carroll, Harford, Howard and Queen Anne’s counties.
California-Lexington Park: St. Mary’s County.
Cumberland: Allegany County in Maryland and Mineral County in West Virginia.
Hagerstown-Martinsburg: Washington County in Maryland and Berkeley and Morgan counties in West Virginia.
Silver Spring-Frederick-Rockville: Frederick and Montgomery counties.
Baltimore City
Calvert-Charles-Prince George’s

The chart below shows nonfarm employment declines by Maryland metro area in 2020.

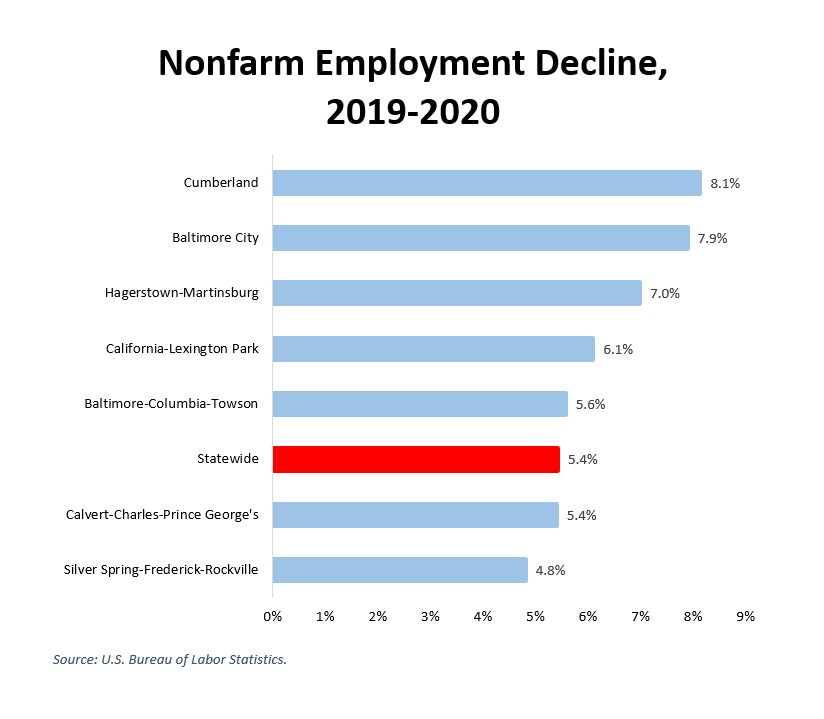
According to the state’s wealth measures, Allegany County, Washington County and Baltimore City, which had some of the largest job losses, are three of the least wealthy jurisdictions in Maryland. The Silver Spring-Frederick-Rockville metro area, which had one of the smallest job losses, is dominated by Montgomery County, one of the wealthiest jurisdictions in Maryland. This chart, while admittedly incomplete, hints at widening geographic inequality between different parts of the state.

The chart below shows change in average hourly earnings by Maryland metro area in 2020.

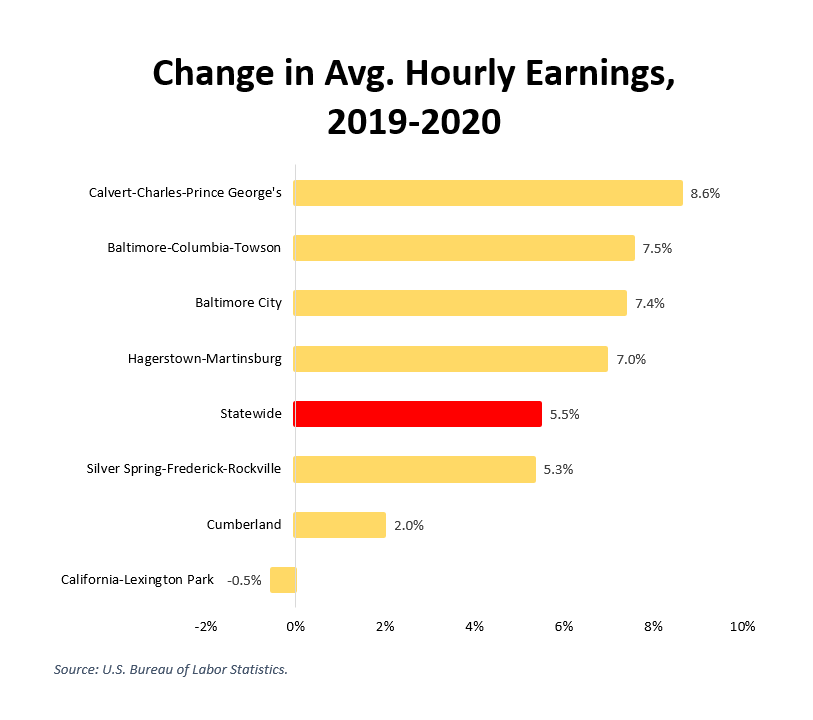
California-Lexington Park (St. Mary’s County) is the only metro area here showing a drop in average hourly earnings. All the other areas show an increase exceeding the 1.4% rise in the national consumer price index last year. Remember what we learned in Part Three: because low-wage workers have likely been disproportionately affected by the COVID recession, a rising average wage is probably a sign of rising income inequality. This chart, while also incomplete, hints at rising inequality inside many local jurisdictions in the state.

There is a silver lining for state and local budgets here: low income workers pay lower absolute amounts of property and income taxes than higher income workers. To the extent that the recession’s impact falls disproportionately on the lower end of the income distribution, budget losses may turn out to be less than initially feared. But that’s cold comfort to those who have been let go from payroll jobs and have turned to the gig economy to survive. Governments that benefit from less-than-expected budget pain have a responsibility to help these people until the economy revives.

Share

Why Are Average Wages Increasing During the Pandemic? Part Three

By Adam Pagnucco.

In Part Two, we identified one reason why average wages have been rising during the COVID recession: job losses have been concentrated in the leisure and hospitality sector. Since that sector pays low wages, disproportionate job losses there tend to push average wage rates up.

But that’s not all that is going on.

The chart below shows changes in average hourly earnings by sector in Maryland. Most sectors are seeing substantial increases, with some beating the 1.4% change in the consumer price index in 2020 by several multiples.

The craziest finding in that chart is that leisure and hospitality, which had by far the biggest job loss in 2020, also had the largest increase in average hourly earnings. That violates every lesson in supply and demand taught in Economics 101. An industry with precipitous job losses should have a big drop in wages. Why is the opposite happening?

Let’s take a closer look at Maryland’s leisure and hospitality sector. The chart below shows employment (on the left axis) and average hourly earnings (on the right axis) in leisure and hospitality since 1990. (Average hourly earnings are only available starting in 2007.) For the most part, this is what we would expect to see. Employment has grown with interruptions in the early 1990s recession, the Great Recession and the COVID recession. Average hourly earnings fell during the Great Recession and recovered afterwards. So far, so good.

Now let’s zero in on the last two years. The chart below shows the monthly employment in the sector for both 2019 and 2020. (Data for December 2020 is preliminary.)

In the first two months of 2020, Maryland’s leisure and hospitality sector was on pace to have 2-3% more jobs than in 2019. Then the pandemic hit and in April 2020, employment was 47% less than in April 2019. The sector recovered somewhat though it did not enjoy the summer bump that it normally gets. By November and December, when COVID case rates began to rise again, the sector began losing jobs again. Overall, its employment in 2020 seems tied to public health restrictions and consumer behavior tied to the virus.

Now let’s look at monthly average hourly earnings in the sector in 2019 and 2020.

The massive job loss in April coincided with a massive spike in average hourly earnings. The smaller job loss in the last two months of the year coincided with a smaller spike in average hourly earnings. At first glance, this doesn’t seem to make much sense if you remember supply and demand from Economics 101.

But it might make sense depending on who gets laid off. The leisure and hospitality sector, like other sectors, has wide variations between employees in skill, seniority and responsibility – all of which tend to be associated with pay differentials. What if the workers who were laid off in April and in the winter were disproportionately low tenure, less skilled and non-supervisory? And what if the workers who were protected were disproportionately highly skilled, high tenure, supervisory and critical to their employers? That would explain the pattern in leisure and hospitality and in the other sectors too: job losses coincide with average hourly earnings spikes because lower paid workers are the ones being let go, thus skewing the wage distribution upwards.

This coincides with findings cited by the U.S. Bureau of Labor Statistics that job losses have been “strongly concentrated among low-wage workers,” including hospitality workers, young workers, less educated workers and part-time workers. One article finds that “the pandemic’s negative economic effects are most severe and likely to be longest lasting for low-paid workers in more affluent locations.” That’s a good description of the realities faced by many recession-impacted workers in Maryland, who are hit both by job losses and high costs of living. Think of how this applies to a laid-off restaurant employee in Montgomery, Howard or Anne Arundel counties.

If this theory is true, then the rising average wages during the COVID recession are not a sign of prosperity – they’re a sign of rampant, increasing income inequality. In Part Four, we will see how this is playing out in some locations in Maryland.

Share

Why Are Average Wages Increasing During the Pandemic? Part Two

By Adam Pagnucco.

In Part One, we recited a central lesson from Economics 101: wages are prices affected by supply and demand for labor. In prior recessions, wages either stagnated or fell – a result we would expect as jobs declined and hiring opportunities fell short of available workers. However, the COVID recession has seen one of the biggest average wage increases in the last half century.

Why?

One key to understanding this is to examine how the COVID recession has impacted specific industries. The chart below shows the decline in employment from 2019 to 2020 by industrial sector in Maryland. (Data for December 2020 is preliminary, which may have a minimal impact on the final results due from the U.S. Bureau of Labor Statistics in a month or two.)

Every industrial sector in Maryland has lost jobs in 2020 except for mining, logging and construction, which actually grew by 2%. This sector is dominated by construction and employers in that industry were likely building a lot of projects that were approved before the pandemic or in its early stages. The sector that took the biggest hit by far was leisure and hospitality, which is comprised of hotels, motels, restaurants, bars, casinos, museums, performing arts, sports and related industries. That makes sense. These industries were among the most affected by health restrictions and they have suffered mightily from declines in travel and tourism.

Now let’s look at the average hourly earnings in these sectors in 2020.

Leisure and hospitality, which had by far the biggest job hit, was also the lowest paying sector in Maryland. When the lowest paying sector loses the greatest percentage of jobs, it skews the overall distribution of wages upward, thereby increasing the average. Also contributing to this skew is that financial activities and professional and business services, the two highest paying sectors, had below average rates of job loss. The jobs that are being lost are disproportionately in lower paying industries. That’s one reason why average wages are rising in the COVID recession unlike in earlier recessions.

But industrial impact is not the only factor behind what’s going on. We will have more in Part Three.

Share

Why Are Average Wages Increasing During the Pandemic? Part One

By Adam Pagnucco.

Every college student taking Economics 101 learns about how supply and demand interact to set market prices. Wages are prices set in labor markets. When growth in demand for labor exceeds growth in supply, wages go up as employers bid against each other to hire workers. When the opposite occurs – growth in supply exceeds growth in demand – wages fall as workers compete for a limited number of job opportunities. That’s how it’s supposed to work according to theory, and that’s how it has worked (more or less) in prior business cycles.

But so far, that’s apparently NOT how it has worked during the COVID recession. Why?

First, let’s look at history. The chart below shows average real hourly earnings (in 2020 dollars) for U.S. private sector production workers from 1964 to 2020. Besides the flat U shape, you can see how wage increases moderated during certain periods, like the early 1970s, the early 1980s and the early 2010s. That makes sense since those were periods of recession. Jobs were lost, hiring demand was down and that put downward pressure on wages.

The chart below shows the change in average real hourly earnings and brings out the contrasts shown above even more. Big drops in real wages occurred during the oil embargo recessions of the 1970s and early 1980s and a smaller drop occurred during the Great Recession. Again, this is what we expect to see.

But now look at 2020, the year of the awful COVID recession. Preliminary data indicates that real hourly earnings actually rose by 3.7%, the third HIGHEST real increase on record since 1964. (The two higher ones were 4.0% in 1972 and 3.7% in 2009, both peak years immediately prior to recessions.) Everybody knows there have been job losses during the COVID recession so why are average wages going up?

We’ll have more in Part Two.

Share