
 Top Line: The Republican coalition in Maryland took a sharp turn toward less educated voters and remains heavily white.
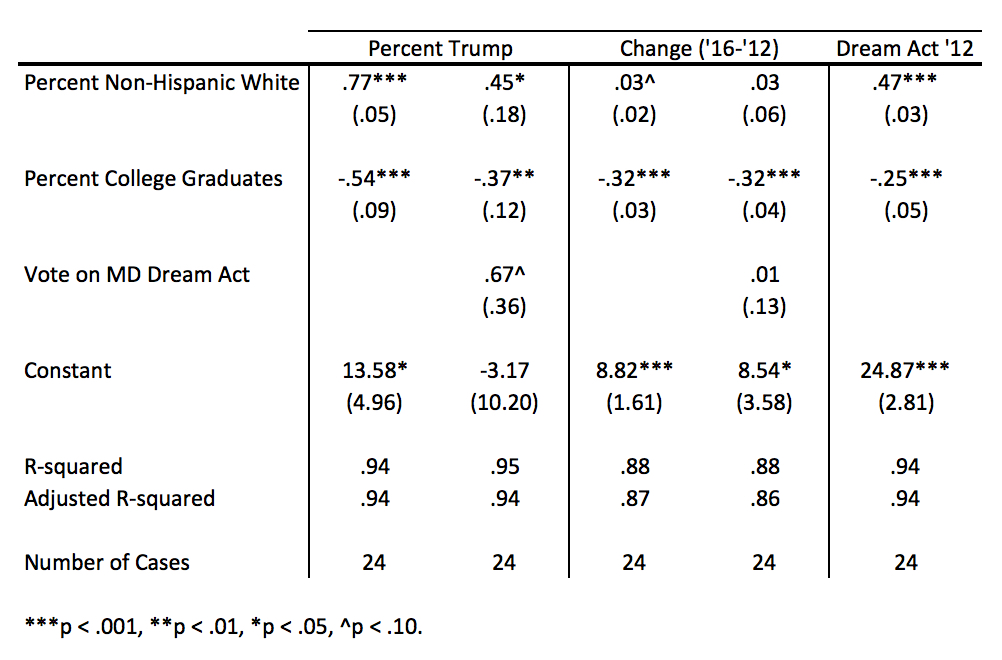
The above is a quickly done ordinary least squares (OLS) regression analysis of aggregate support for Trump and the change in the vote from 2012 to 2016 by county. The numbers in parentheses are standard errors around the coefficients shown above them.
The coefficients are easy to interpret. For example, the coefficient of .77 on Percent Non-Hispanic White in the model of Percent Trump indicates that 1% increase in the non-Hispanic white population resulted in a .77% increase in the Trump vote. Similarly, an increase of 1% in the share of college graduates reduced the Trump vote by .54%.
The second model of the share of the Trump vote in Maryland also includes a control for how counties voted on the MD Dream Act in 2012 as a further control for immigration attitudes. While the results are at the edges of statistical significance, this model indicates that, even after controlling for race and education, that a 1% increase in opposition to the Dream Act resulted in a .67% increase in support for Donald Trump.
The third and fourth models assess the impact of the same variables on the net change in the vote from 2012 to 2016. The change in the vote equals (%Trump – %Romney). Educational levels dominate changes in the share of the vote won by the Republican and Democratic nominees. While neither race nor the opposition to the Dream Act matter much, a 1% increase in the share of college graduates resulted in a loss of .32% by Trump.
The final model shows the relationship between race and college education to opposition to the Dream Act. It suggests that a similar coalition supported Trump in 2016.
