
Elected to Maryland General Assembly in 2014
I’m in the middle of gathering data for a study on the election of African-American and Latino legislators, so I thought I’d share the data for the new Maryland General Assembly.
The Current State of Play
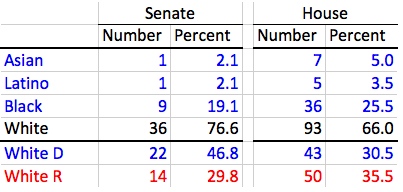
Minorities compose a greater share in the House than the Senate. While whites form three-quarters of all senators, they comprise two-thirds of all delegates. All minority groups are better represented in the House than the Senate.
Excepting the election of its only Asian member, Sen. Susan Lee (D-16), minority groups experienced more notable gains in the House, which saw its Latino and Asian membership more than double from 2010. New Asian delegates include Jay Jalisi (D-10), Clarence Lam (D-12), David Moon (D-20), and Mark Chang (D-32). David Fraser-Hidalgo (D-15), Maricé Morales (D-19), and Will Campos (D-47B) are incoming Latino delegates.
Partisan Gaps
Every single Asian, Latino, and Black member of the General Assembly is a Democrat. Whites remain split between the two caucuses. Interestingly, a majority of white delegates now sit as Republicans (50-43). Together, Asian, Latino, and Black delegates now form a majority of the Democratic House Caucus (47-43).
In the Senate, however, White Democrats form two-thirds of the Democratic Caucus and heavily outnumber White Republicans by 22 to 14. The greater preponderance of white Democrats stems partly from the greater success of Democrats in the Senate–all marginal seats are white majority districts.
The glaring gaps in the racial composition of the two parties reflects a national trend. African Americans have voted overwhelmingly Democratic since 1964. President Obama has increased the share of both Latinos and Asian Americans who vote Democratic. While his 43% of the white vote in 2008 exceeds that won by Clinton, Gore, or Kerry from 1992-2004, Obama won 39% of the white vote in 2012.
Racial gaps in voting are actually more muted in Maryland than many other places (i.e. more whites vote Democratic). In many southern states, blacks form a clear majority of a much smaller Democratic Caucus. Congress has no white members from a single state in the Deep South.
Assessing Racial Proportionality
American Community Survey Population Estimates
 The ratio of representation to population depends on how you measure both population and race. While districts are drawn based on total population, only adult citizens can vote. In addition to the total population, the above table shows the voting-age population (VAP) and citizen voting-age population (CVAP).
On the Census form, people can now check multiple racial boxes (e.g. both White and Asian) and Latino is a separate category. The table includes only non-Latino Asians, Blacks and Whites who checked just one box in the appropriate category.
Minors comprise a higher share of the Black and Latino population than the Asian and White population, so the share of Blacks and Latinos among the VAP is lower than among the total population. Due to lower citizenship rates among Asians and Latinos, both groups comprise lower shares of CVAP than the VAP.
The net impact is that White Marylanders form 3.4% more of the CVAP than the total population. Latino Marylanders are 8.5% of the total population but just 5.7% of CVAP. Similarly, Asian Marylanders are a lower share of CVAP than the total population. The net effect for African-American Marylanders is almost a wash with a net gain of 0.6% in CVAP over the total population.
Changes Required for Racial Proportionality
No matter how you slice it, however, the share of Whites is higher than their share of the population in both the House and the Senate. African Americans, the largest minority group in the State, would need to add four senators and six delegates to their ranks to pull even with their share of Maryland’s CVAP.
However, Asians would need just one more senator to achieve CVAP parity in both houses. Latinos require one more senator and three additional delegates to draw even with Latino CVAP–a share still two-thirds of the Latino share of the total population.
