
The Michael Brown shooting in Ferguson, Missouri has attracted attention to African-American representation in municipalities. Blacks are underrepresented on the police force, comprising just three of the city’s 53 officers.
Additionally, only one of Ferguson’s six councilmembers is African American in a city that is now 67% black. Over at the Monkey Cage, Brian Schaffner, have done an excellent job of explaining the political dynamics underlying this disparity. Essentially, the electorate in the off-year municipal election is much more white than in presidential elections.
So how does Maryland do?
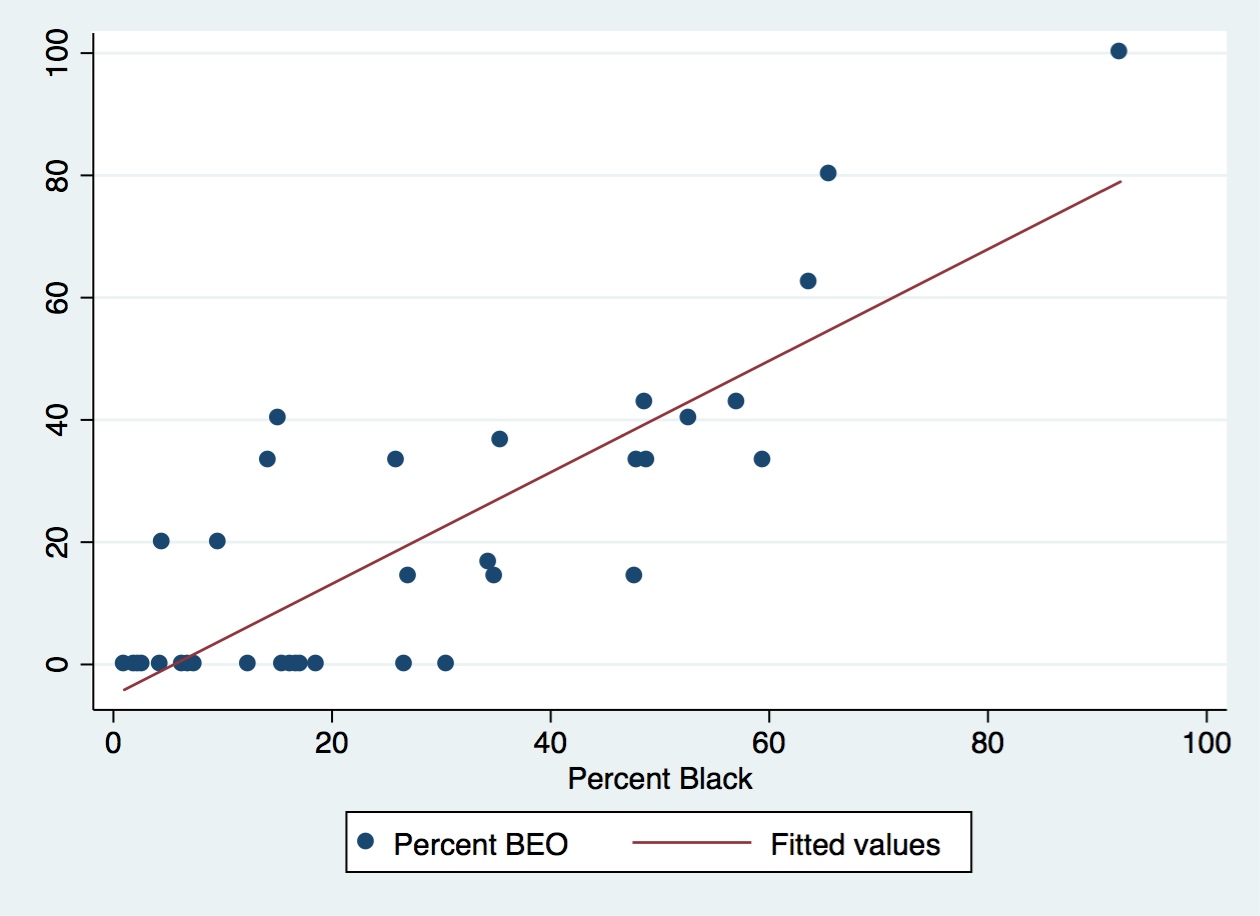
Presented here are two graphs of the percentage of Black Elected Officials (BEOs) against the percentage of Blacks in the 35 largest municipalities in Maryland. The share of BEOs is measured out of the total number of councilmembers plus the mayor–if there is one. The graph at the top of the post shows each city as a dot while the graph below replaces the dots with city names.
The line in each graph reveals the predicted relationship between percentage black and percentage of BEOs according to linear regression. (The short, short course on linear regression: the line is the one the minimizes the sum of the squared vertical distance between the dots and the line.)
The line suggests that a 10% increase in the share of blacks results in a 9.1% increase in black representation. The total predicted share of black municipal officials is about 5% lower than the number predicted by 9.1% x Percent Black. This 5% lag is not that shocking as the share of voting-age blacks often lags behind the share of blacks in the population due to the greater share of minors in the African-American population.

Next up: a closer look at individual municipalities.
