Voters Oust Longest Serving Garrett Park Mayor

In a close election, the voters of Garrett Park turned out incumbent Mayor Peter Benjamin and elected former Town Councilmember Kacky Chantry to the position. The two incumbent candidates for the Town Council were unopposed.

Mayor
Kacky Chantry, 243
Peter Benjamin (i), 232

Council
Jane McClintock (i), 341
Hans Wagner (i), 338

Turnout
Registered Voters, 903
Ballots Cast, 478
Rejected Ballots, 0

Benjamin has served as Mayor of Garrett Park repeatedly, first being elected to the position in 1996 and 1998. Nancy Floreen, now an at-large County Councilmember, then served a single term. After winning election to the Council in 2002, Benjamin was then appointed to fill a mayoral vacancy (caused, I imagine, by Mayor Floreen’s election to the County Council).

Benjamin served another term on the Council from 2005 through 2007. He began his most recent stretch as mayor in 2012 and was reelected to two more terms in 2014 and 2016 before being defeated by 11 votes in this election.  Adding his six terms together, Benjamin has served twice as long as any other mayor of the Town.

Incoming Mayor Kacky Chantry previously served two terms on the Town Council starting in 2013. You can learn more about the views of the incoming mayor and all of the candidates from the most recent edition of the Garrett Park Bugle.

Share

Washington Post Endorsements Should be Coming Out Soon

By Adam Pagnucco.

Most influential endorsements have been made in our state and local races but one big one still has to drop: the Washington Post.  In contested races for Executive and County Council over the last three cycles, the Post has gone 18-7 – a 72% win rate.  Its misses included Howie Denis (Council D1, 2006), Mike Subin and Bo Newsome (Council At-Large, 2006), Royce Hanson (Council District 2, 2010), Duchy Trachtenberg (Council At-Large, 2010), Tom Moore (Council District 3, 2014) and Evan Glass (Council District 5, 2014).  Other than maybe Newsome, all of these were credible candidates and three (Denis, Subin and Trachtenberg) were incumbents.  In 2014, the first mid-term year in which Maryland had a June primary, the Post endorsed for Executive on May 2, for County Council on May 26 and for General Assembly on May 30.  Candidates are eager for the Post to endorse sooner rather than later because they would like to add the endorsement to their yard signs, mail and walk lit.

We know that the Post has been interviewing Executive and County Council candidates.  We would not be surprised if their endorsement for Executive comes out in a matter of days.

Share

Valerie Ervin Issues Statement

Valerie Ervin Issues Statement Following the Passing of Kevin Kamenetz
PIKESVILLE, MD (May 10, 2018) — Valerie Ervin today issued the following statement:

“Like so many, I am shocked and heartbroken by this sudden and unexpected loss. I want to thank those across Maryland for their outpouring of support, sympathy, and gratitude during this difficult time.

“Kevin was first and foremost a loving husband to his wife Jill and a proud father to Karson and Dylan. And he was a dedicated, bold leader who served the people of Baltimore County for over 20 years. I have been honored to call him a friend and partner.

“Today all of Maryland mourns with his family, friends, and loved ones.”

Share

Taxpayer Flight from MoCo, Part Four

By Adam Pagnucco.

In Part Three, we saw that MoCo’s problem of taxpayer flight is shared by most jurisdictions in the Washington region.  But what happens when we look at MoCo’s taxpayer inflows and outflows to and from each of its large neighbors?  From whom does MoCo gain income on net?  And to whom does MoCo lose income on net?

We looked at net gains and losses between MoCo and nine other local jurisdictions plus two states.  Let’s start with the two jurisdictions from which MoCo has net gains of taxpayer income: D.C. and Prince George’s.

District of Columbia
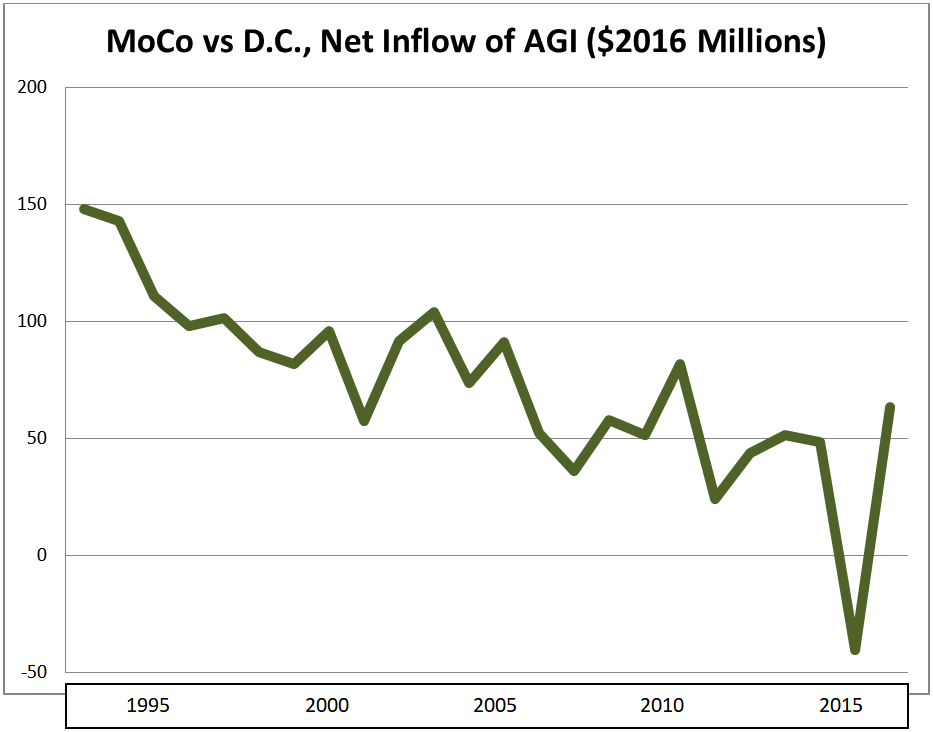
Net change in tax returns, 2006-2016: +1,070 (inflow)

Net change in adjusted gross income ($2016), 2006-2016: +$417 million (inflow)

Adjusted gross income of in-migrants ($2016), 2006-2016: $94,696

Adjusted gross income of out-migrants ($2016), 2006-2016: $83,038

Migrant income gap: In-migrants earned 12% more than out-migrants

MoCo almost always drains tens of millions of dollars in taxpayer income each year from D.C.  That’s because it gets more in-migrants from D.C. than out-migrants and the in-migrants make more.  This fits a pattern of young people living in D.C. and then moving to the suburbs as their incomes grow and they are ready to have kids.  However, as D.C.’s economy has improved since the 1990s, the District’s net income flow to MoCo has diminished over time.  In 2015, D.C. even netted a gain of $40 million from MoCo, the first time the District ended up on the plus side of this ledger since this data series began in 1993.

Prince George’s County
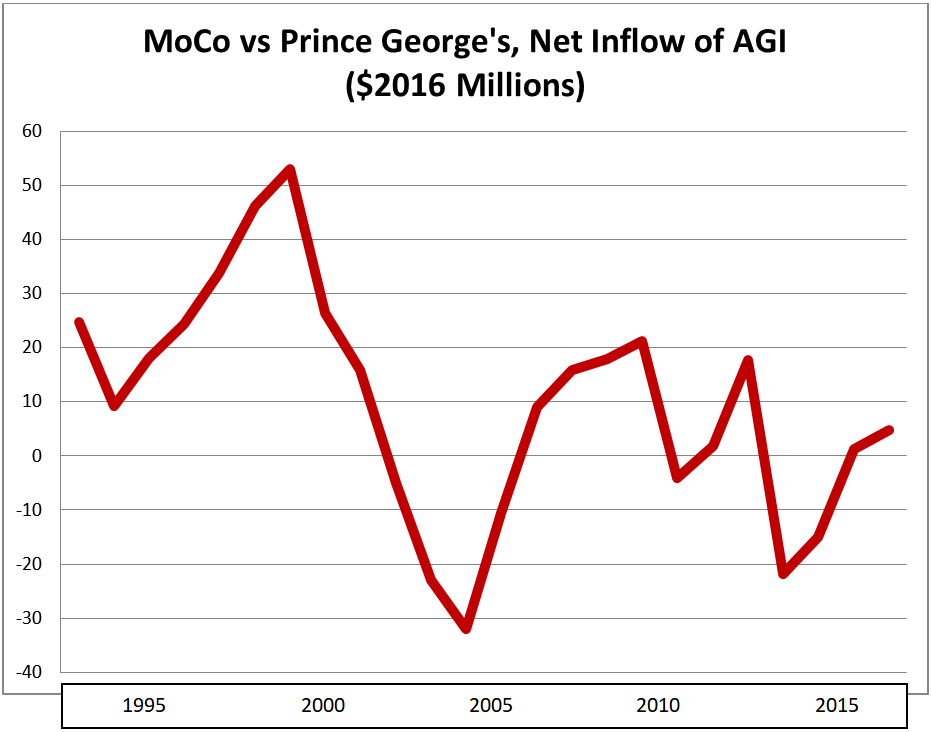
Net change in tax returns, 2006-2016: +834 (inflow)

Net change in adjusted gross income ($2016), 2006-2016: +$39 million (inflow)

Adjusted gross income of in-migrants ($2016), 2006-2016: $42,894

Adjusted gross income of out-migrants ($2016), 2006-2016: $42,802

Migrant income gap: In-migrants earned about the same as out-migrants

In the 1990s, MoCo consistently enjoyed positive income inflows from Prince George’s, but that began to change in the 2000s.  In the last fifteen years, MoCo lost money to Prince George’s seven times.  MoCo may still have a slight advantage but it’s very tenuous and could slip away.

Alexandria City
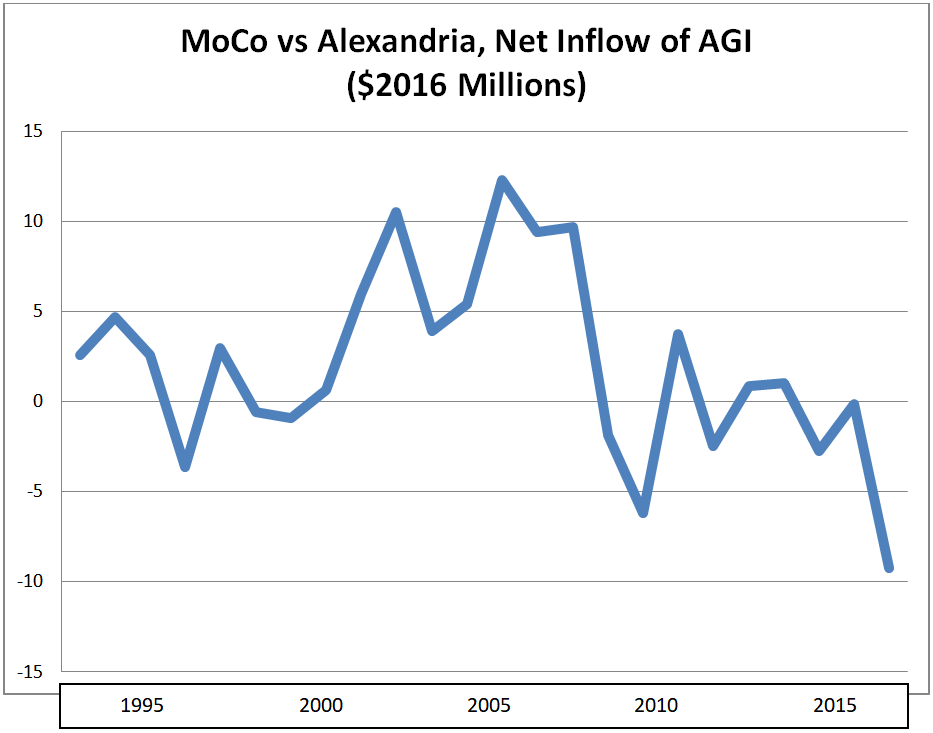
Net change in tax returns, 2006-2016: -346 (outflow)

Net change in adjusted gross income ($2016), 2006-2016: -$7 million (outflow)

Adjusted gross income of in-migrants ($2016), 2006-2016: $78,961

Adjusted gross income of out-migrants ($2016), 2006-2016: $73,304

Migrant income gap: In-migrants earned 7% more than out-migrants

There’s not a ton of migration between MoCo and Alexandria and the two jurisdictions roughly break even, although MoCo’s balance has deteriorated a bit in recent years.

Arlington County
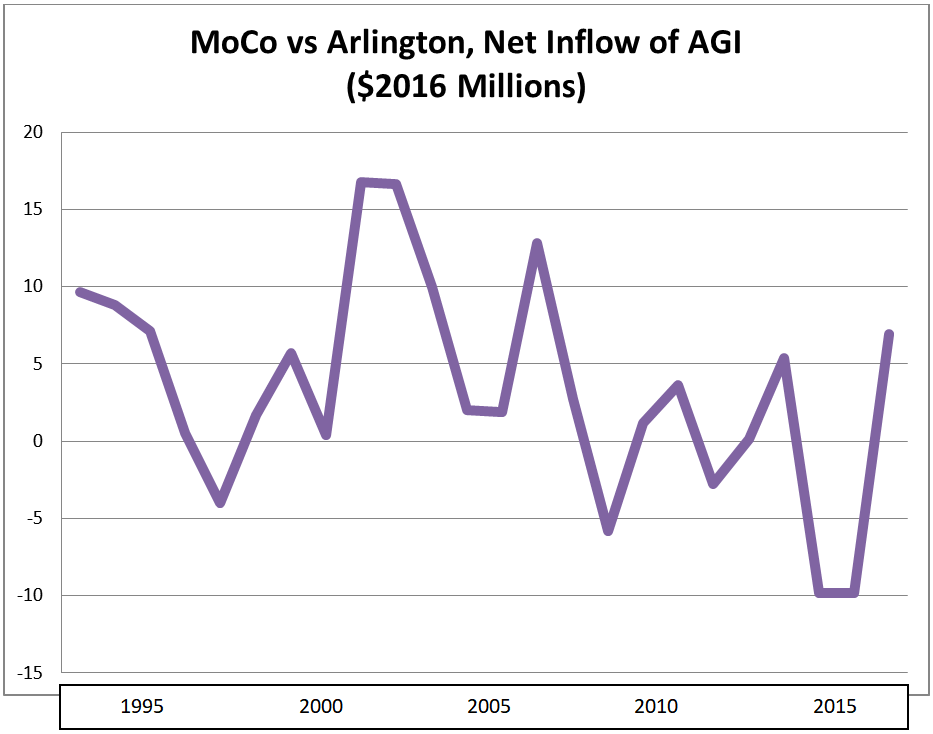
Net change in tax returns, 2006-2016: -1,103 (outflow)

Net change in adjusted gross income ($2016), 2006-2016: -$8 million (outflow)

Adjusted gross income of in-migrants ($2016), 2006-2016: $85,154

Adjusted gross income of out-migrants ($2016), 2006-2016: $72,852

Migrant income gap: Out-migrants earned 14% more than in-migrants

As with Alexandria, MoCo roughly breaks even with Arlington.  Again, MoCo’s balance has gotten slightly worse in recent years.

Prince William County
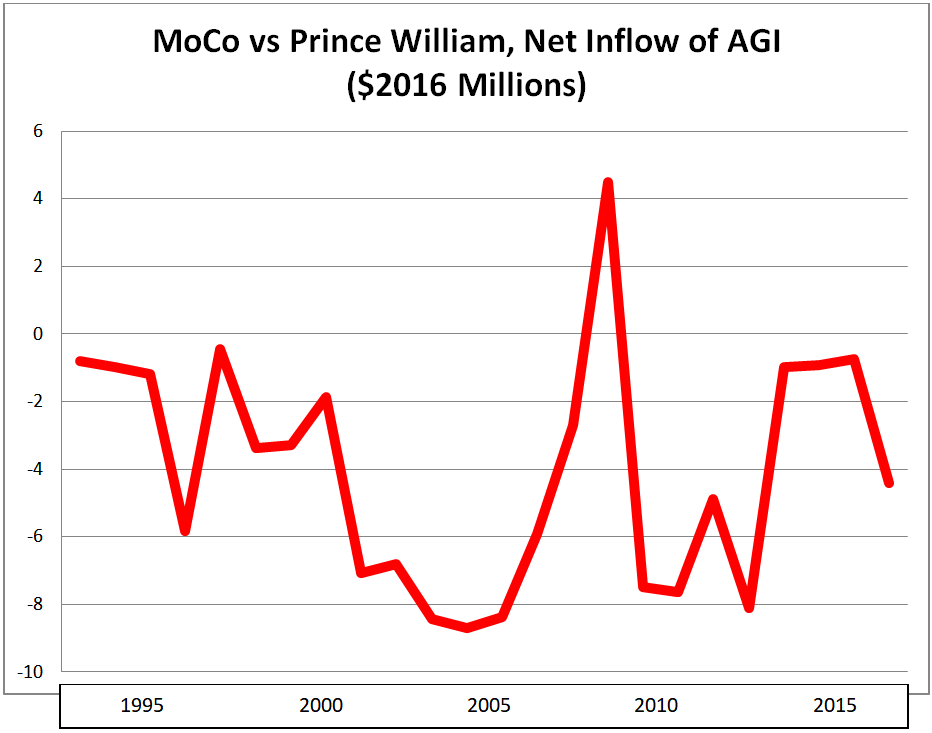
Net change in tax returns, 2006-2016: -289 (outflow)

Net change in adjusted gross income ($2016), 2006-2016: -$33 million (outflow)

Adjusted gross income of in-migrants ($2016), 2006-2016: $50,076

Adjusted gross income of out-migrants ($2016), 2006-2016: $57,436

Migrant income gap: Out-migrants earned 15% more than in-migrants

Prince William has received small inflows of income from MoCo that have diminished in recent years.  Most people moving between the two counties fall in the lower end of the region’s income distribution.

We will conclude tomorrow.

Share

Kevin Kamenetz Died This Morning

Kevin Kamenetz Announces for Governor

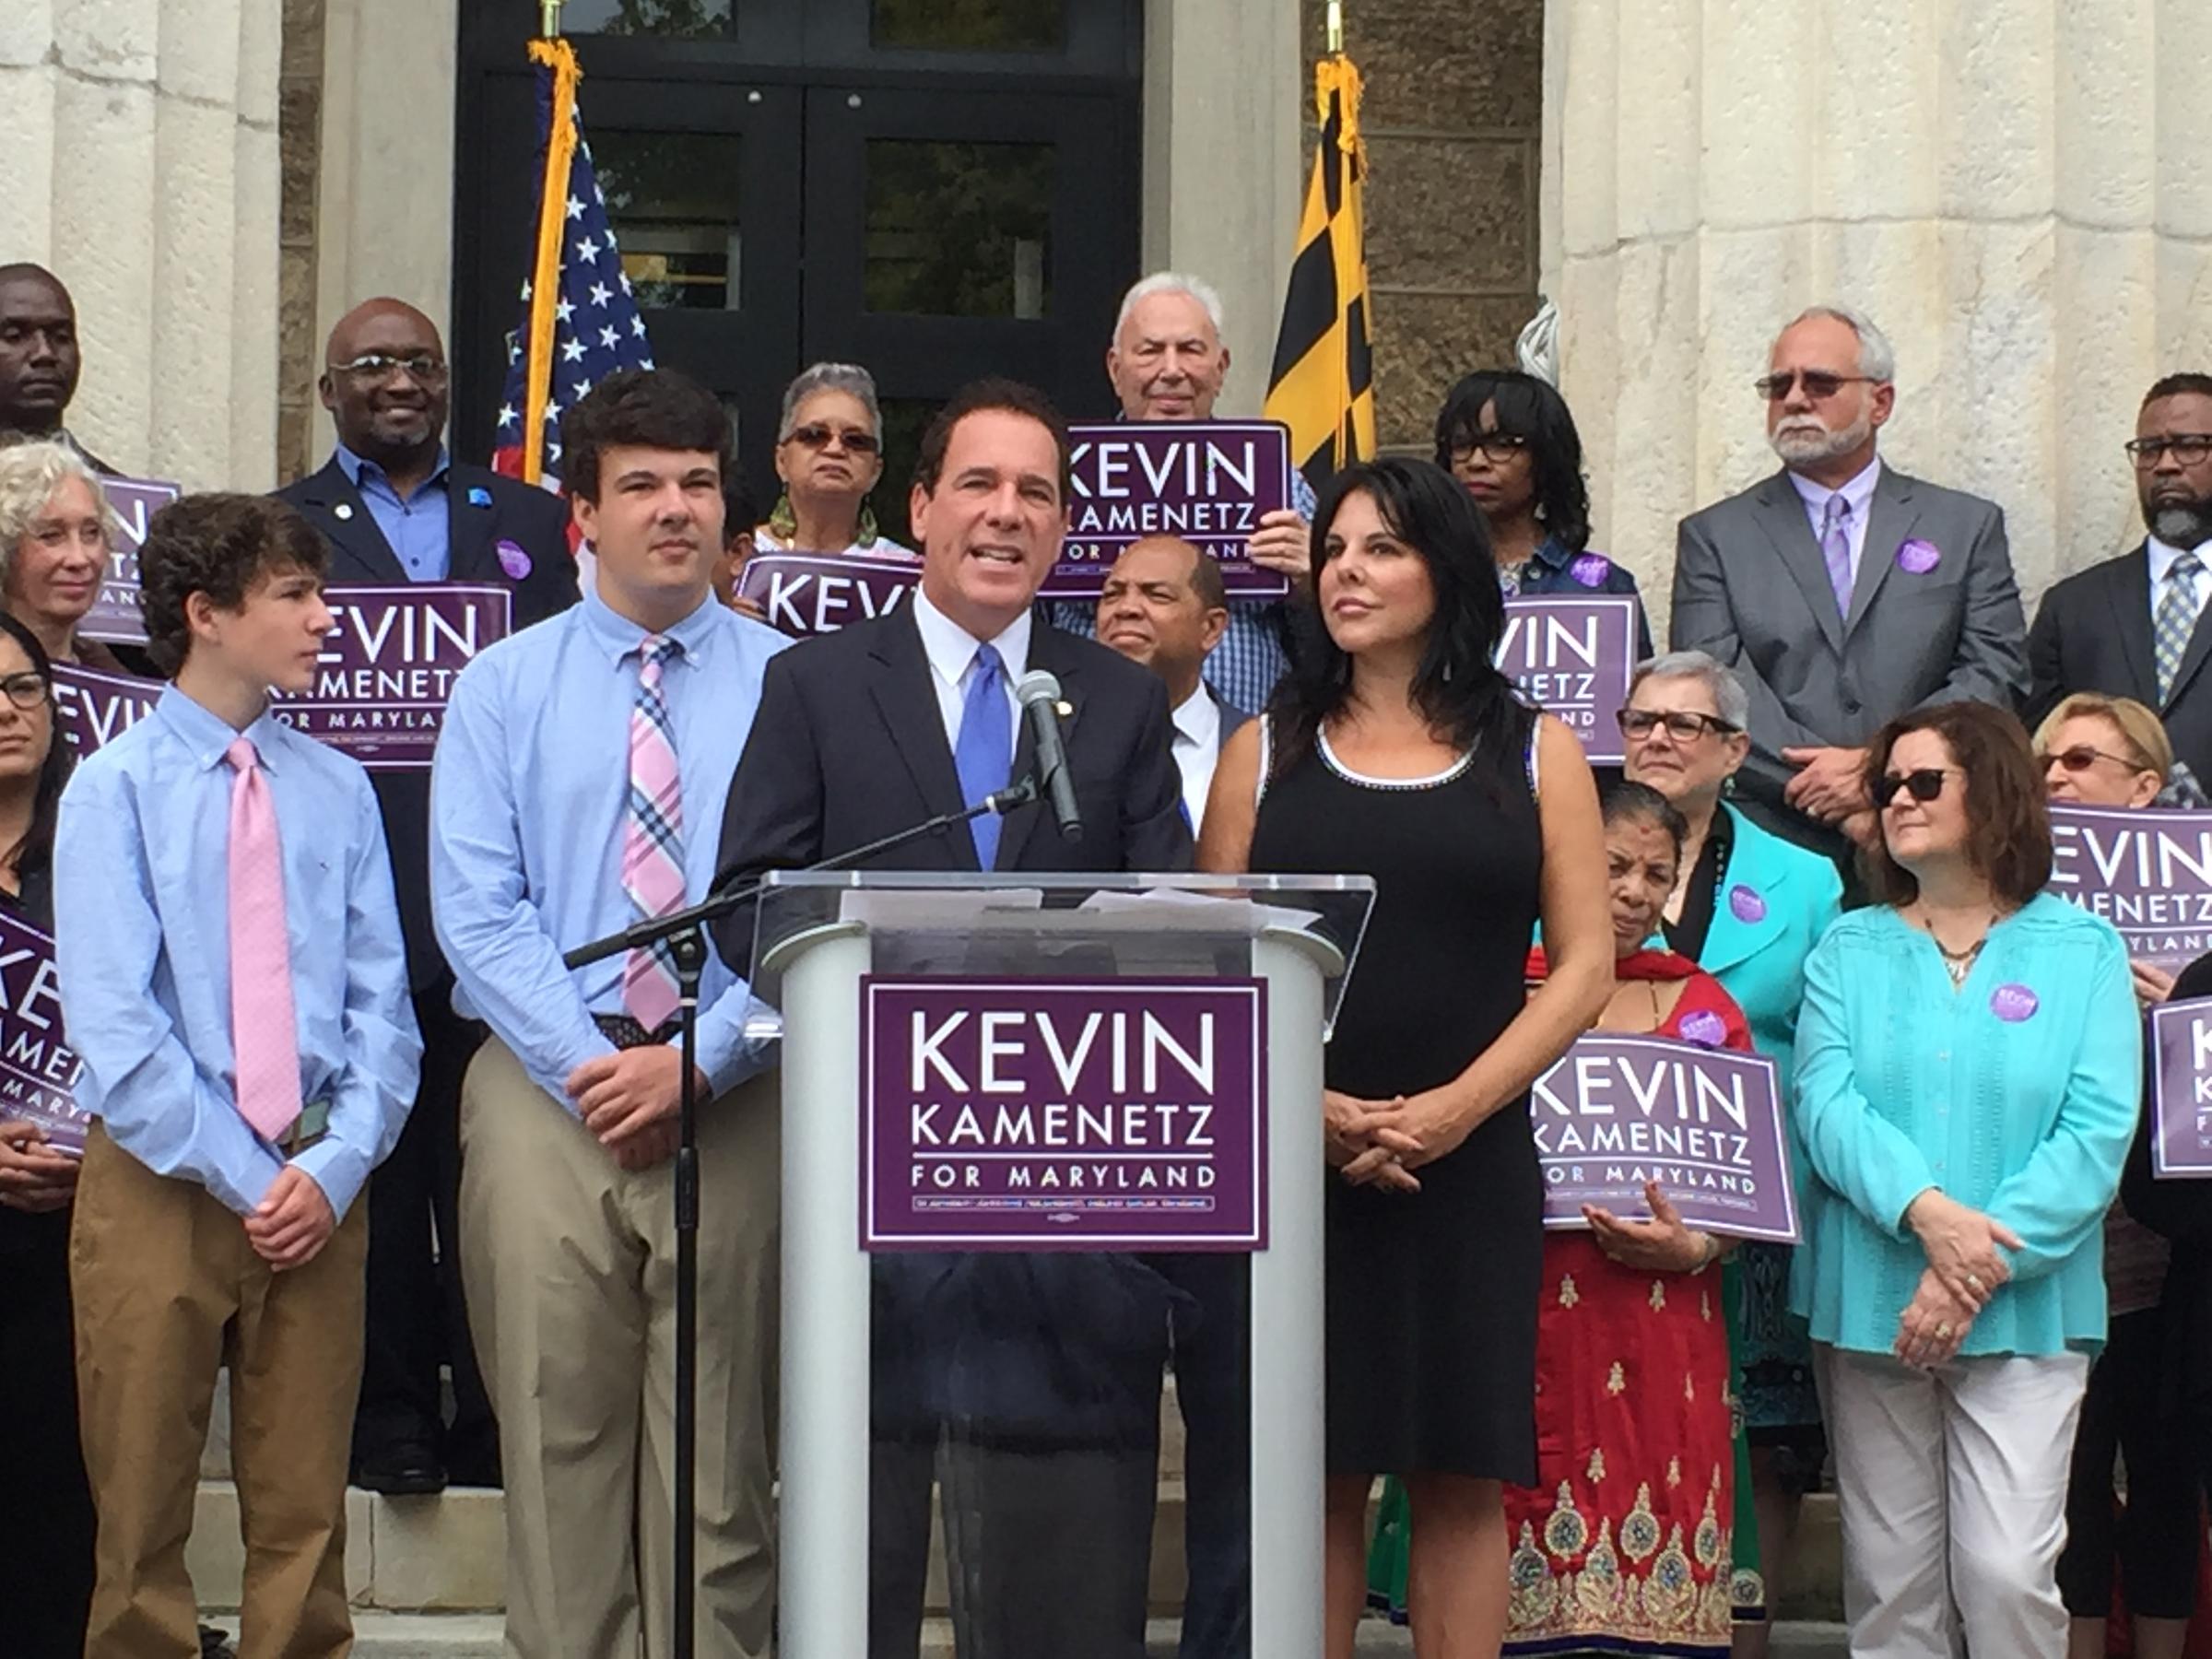
In shocking and horrible news, Baltimore County Executive Kevin Kamenetz died early this morning at University of Maryland St. Joseph Medical Center after cardiac arrest.

Kamenetz was completing his second term as county executive as he launched his gubernatorial bid. Previously, the former prosecutor served four terms on the Baltimore County Council. As the county executive of a large, swing county with deep Baltimore roots, he was a top-tier candidate. Former Montgomery County Councilmember Valerie Ervin was his running mate.

Kamenetz is survived by his wife and two sons. My heart goes out to them and all members of the Kamenetz family.

You can read reports from the Washington Post and Baltimore Sun.

Share

What You Believe about Why Fewer Women Hold Legislative Office is Probably Wrong

The U.S. House up for grabs and many women are running as challengers today incumbents and for open seats. Del. Aruna Miller’s bid for the open Sixth Congressional District is a great example. Many Americans believe that it is harder for women than men to run and to win these elections. In particular, women are subjected to sexist media coverage with too much focus on how they appear. Female candidates also find it harder to raise money and face bias from voters, so they have to be more qualified than men to win election to Congress.

None of this is true.

More specifically, political science research on congressional elections doesn’t support these conclusions. Gender matters in elections but it doesn’t shape House elections in these ways.

Today’s post borrows heavily from research by Jennifer Lawless. Jen is Professor of Government at AU, though we are unfortunately losing her to UVA in the Fall, and Director of the Women and Politics Institute. She has written much of the best and most cutting edge scholarship on women running for office. In particular, I rely on a book she coauthored with GWU Prof. Danny Hayes, Women on the Run: Gender, Media and Political Campaigns in a Polarized Era.

Media Coverage

Let’s start with the media. In their study, Hayes and Lawless looked at articles in the top local newspaper from the last month of every 2010 and 2014 congressional campaign. Despite their decline, newspapers remain the most influential source of U.S. House campaign coverage. Among the 4,524 articles coded, they found exactly 32 references to candidate appearance:Source: Danny Hayes and Jennifer L. Lawless, Women on the Run, p. 66.

In other words, 0.7% of newspaper campaign coverage mentioned appearance. Rather than harping constantly on candidate appearance, such discussion is almost nonexistent in newspaper coverage of congressional candidates. One reason for the decline is that the novelty of women running for Congress has vanished for the most part.

Another is that men and women run very similar campaigns in terms of the issues that they discuss. Hayes and Lawless find that party plays a far greater role than gender. Analysis of congressional candidate television ads and tweets reveals that candidates tend to emphasize similar issues with gender differences being small and only rarely statistically significant.

Similar campaigns result in similar press coverage. Gender differences in the issues emphasized in newspaper coverage are small and usually not statistically significant. As the focus on issues specific to one gender is small, so is coverage of those issues. Additionally, while party plays an enormous role in how voters view candidates, gender differences are once again small (often to the benefit of women) and not statistically significant.

Winning Elections

When women run for Congress, they do just as well as men.

This is not a new conclusion. In her 1996 book, A Women’s Place is in the House: Campaigning for Congress in the Feminist Era, Barbara Burrell did not find that women are penalized for their gender by voters at the polls. Hayes and Lawless arrived at the same conclusion in their more recent study of the 2010 and 2014 elections.

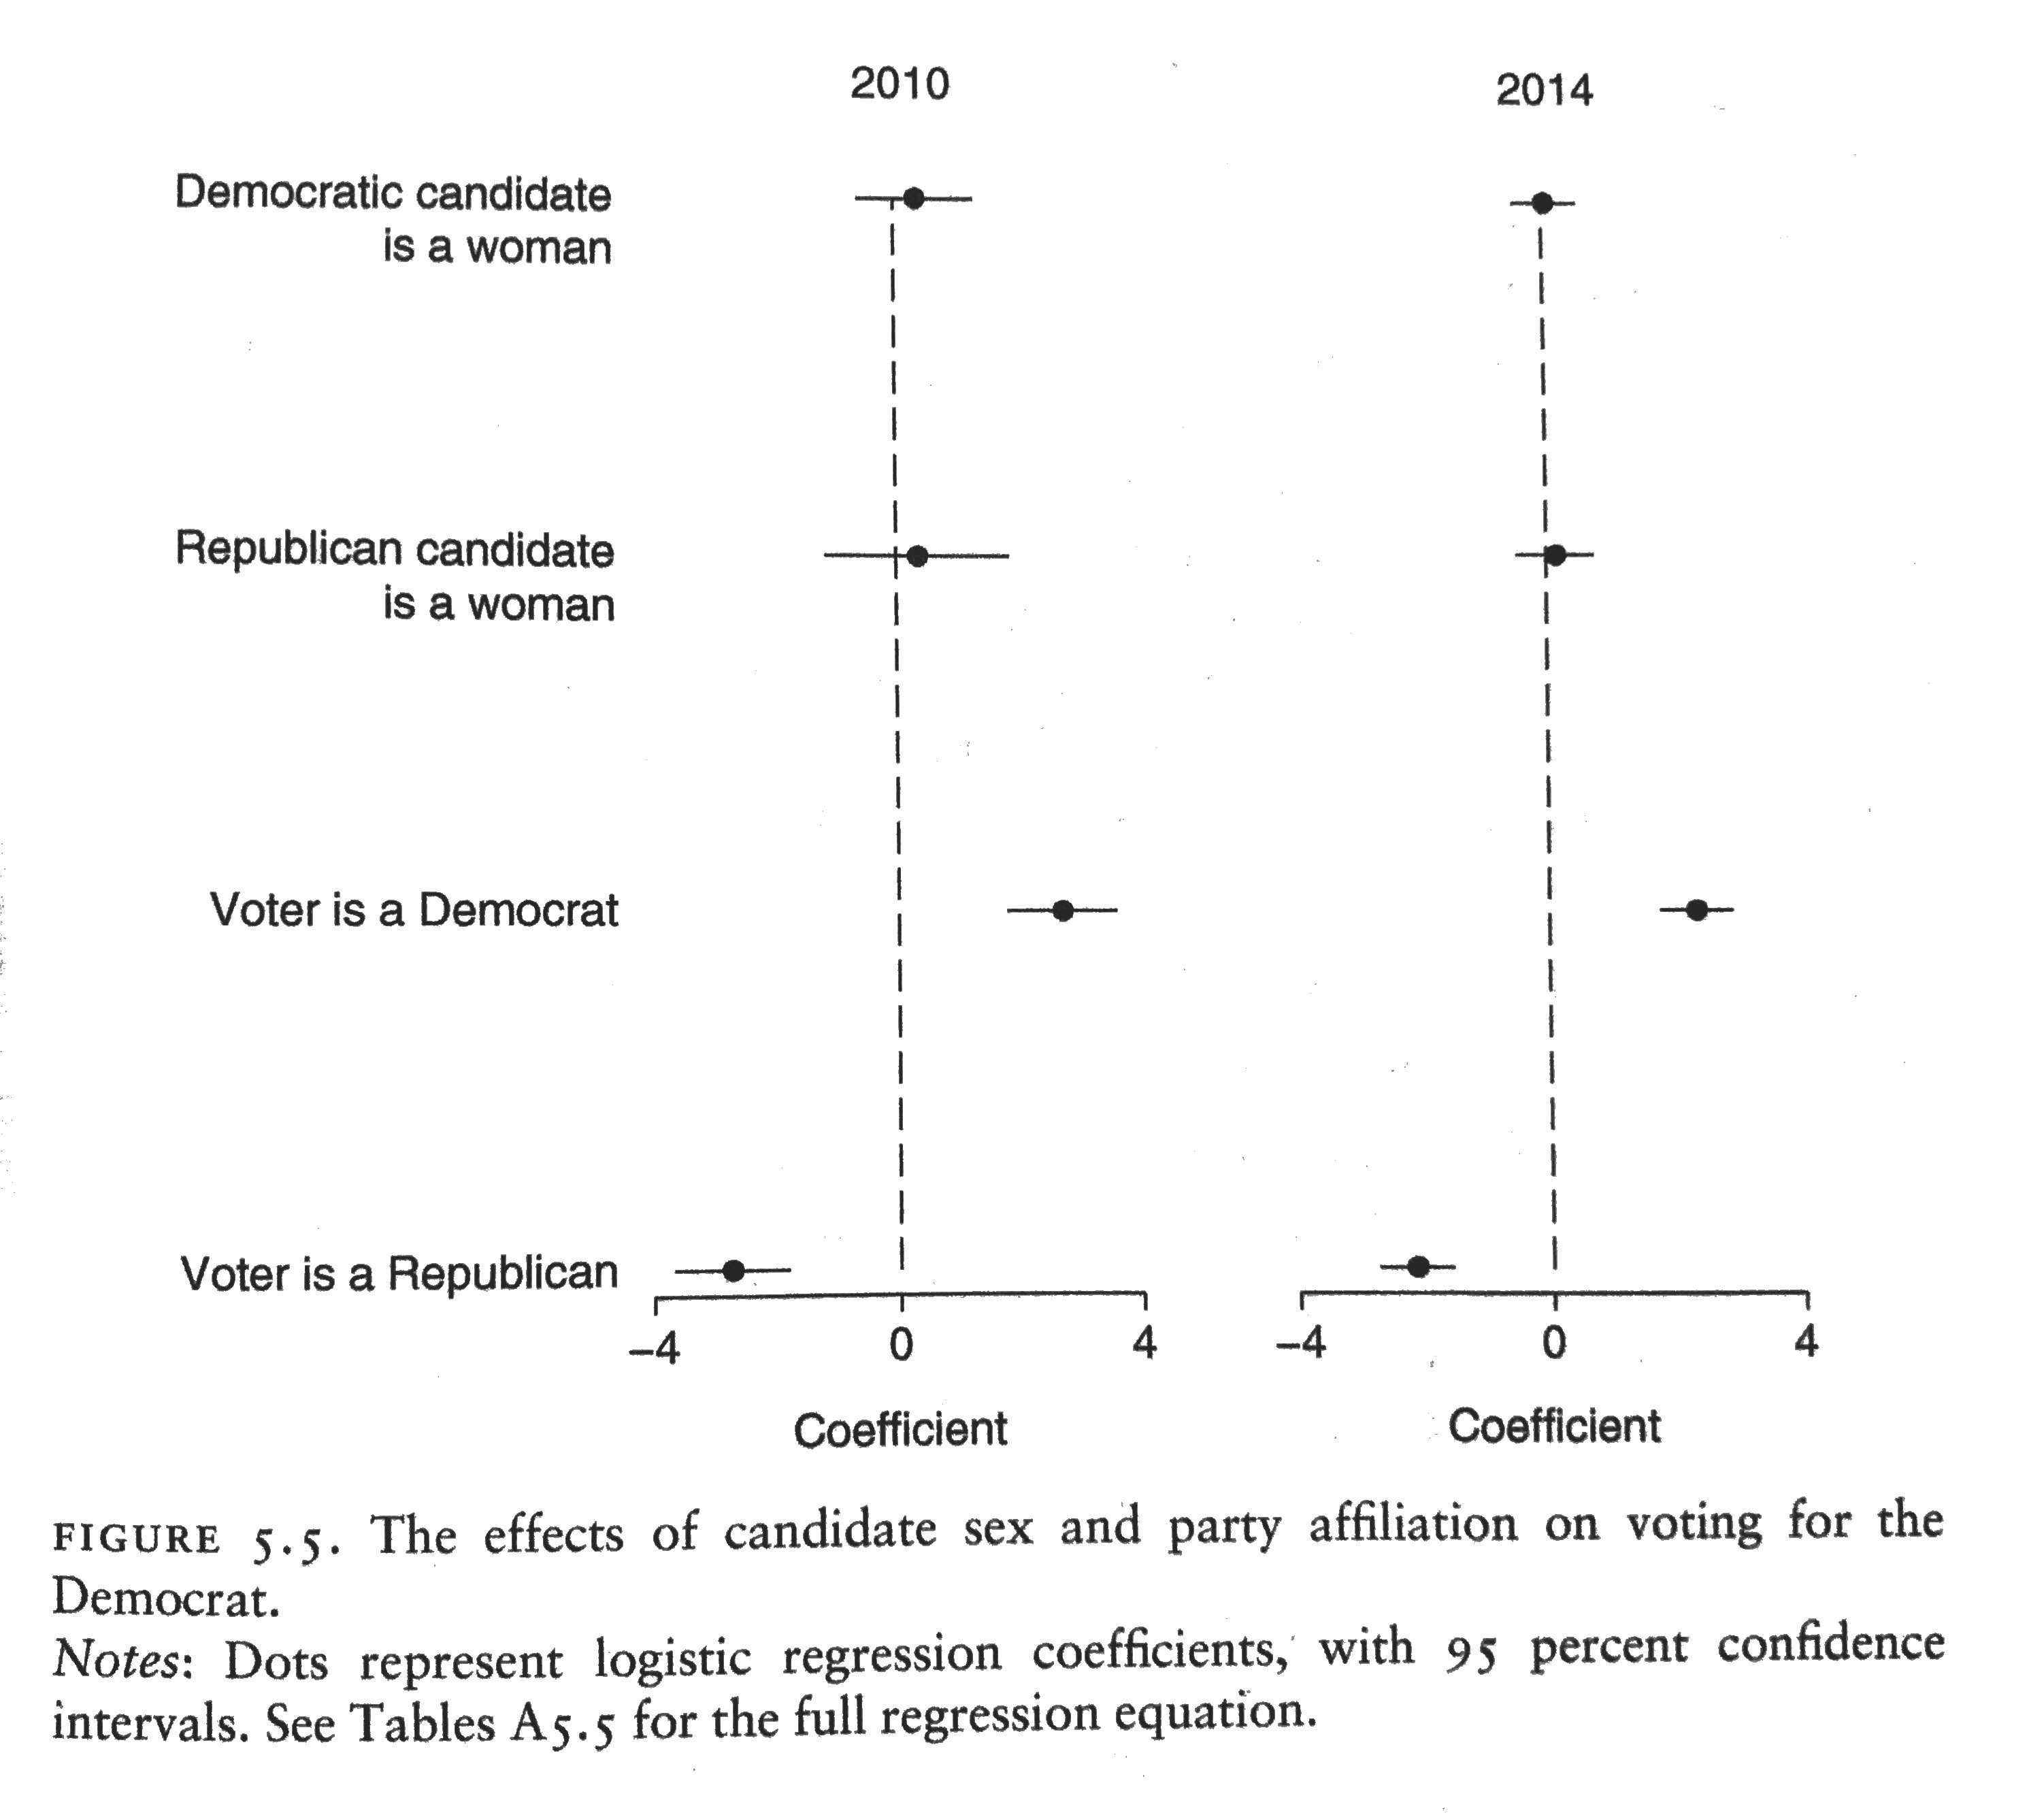
Source: Danny Hayes and Jennifer L. Lawless, Women on the Run, p. 107.

The graph above presents the relative impact of gender and party on the probability of a the success of the Democratic U.S. House candidate after controlling for a variety of factors. Gender has almost no impact, as indicated by the small coefficients. The overlap of the confidence intervals, shown by the lines around the dots, with zero indicates that candidate gender has no statistically significant impact on the outcome.

Other research not reviewed here also indicates that women do just as well in raising campaign funds – no real surprise as women dominated the world of fundraising at the national Democratic Party even 30 years ago in the late 1980s. They also don’t need to be more qualified – women do just as well as men with equivalent qualifications.

So why do women hold substantially fewer elected offices than men in the U.S.? That’s the subject of tomorrow’s post.

Share

Skewed Metro Ridership Forecasts Too High

We can’t rely on WMATA ridership forecasts.

Today, I look at forecasts for MetroRail and MetroBus for the two most recent comparable periods with available data. In the period from July 2017 through March 2018, MetroRail forecasts were above projections in four months and below in five months.

This doesn’t sound too bad until one examines the overall numbers. Metro overestimated ridership for these nine months by nearly 2.8 million. Actual ridership was 2.1% lower than expected by WMATA in its budget forecasts.

On the good news front, the rail ridership forecasts were not as off as the previous year.

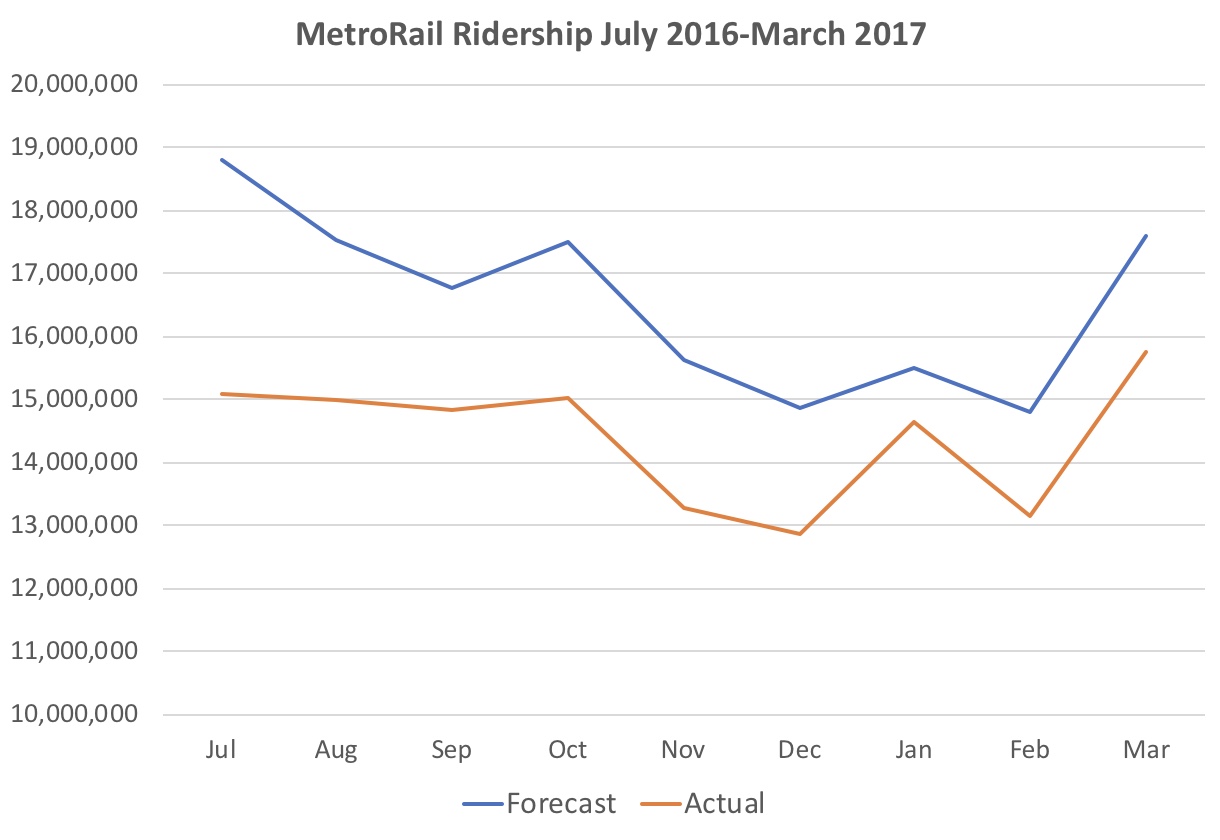
In July 2016 through March 2017, WMATA overestimated rail ridership every single month, resulting in a net overestimate of 19.4 million or 13.0%. However, though WMATA projections are less wildly optimistic, notice that the skew direction remains the same.

The improvement was less strong in MetroBus ridership forecasts and the skew direction remained overly rosy. Here are the projected and actual MetroBus ridership for the most recent period.

WMATA projected more MetroBus riders every month than expected with the projections worse in the most recent months. Overall, there were nearly 4.5 million, or 5.1%, fewer riders than anticipated by the budget forecasts.

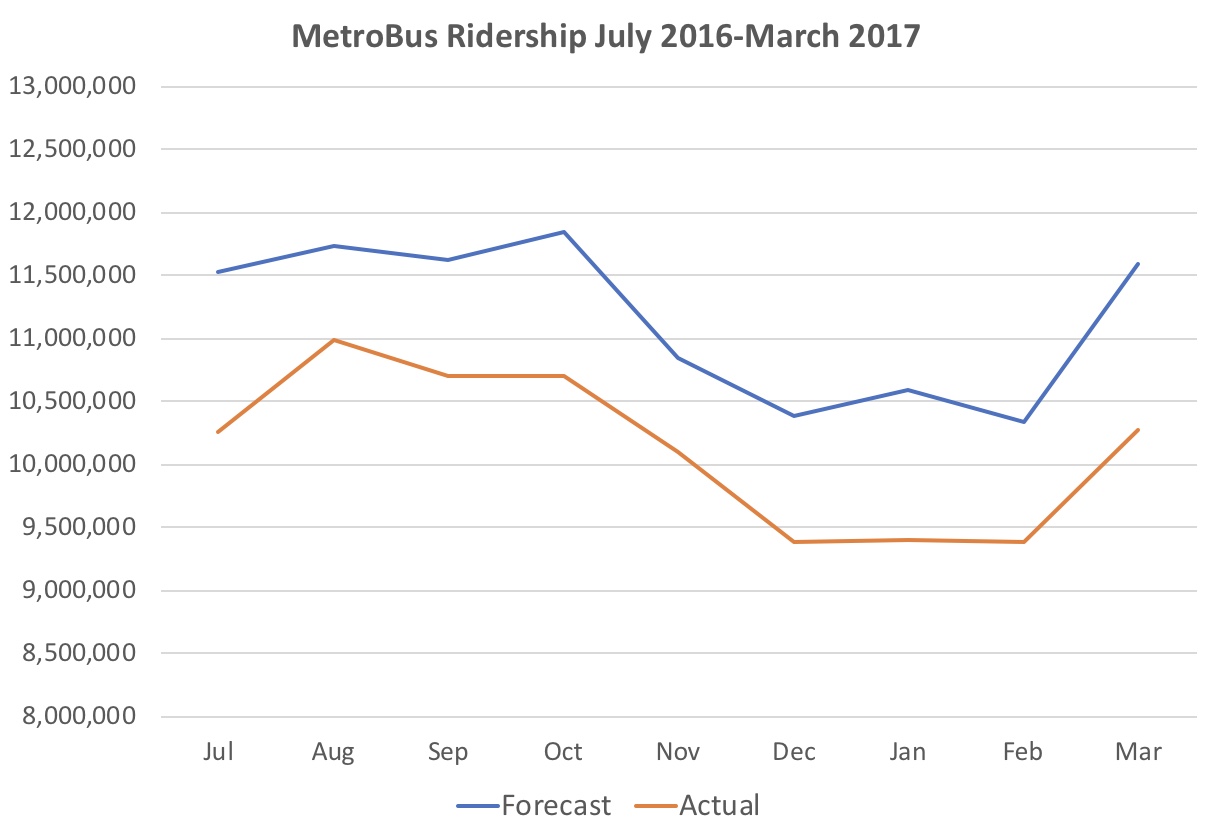
Like for MetroRail, the previous year’s MetroBus projections were abysmal.

The previous year’s projections were off by even more in every single month. WMATA overestimated MetroBus ridership by 9.3 million. Actual ridership was 9.2% lower than the forecast.

WMATA needs to reform its projections so they do not skew in favor of overestimating ridership. Indeed, if anything, it would be better to err on the conservative side since Metro’s budget relies in part on the expected collection of fares related to these projections.

Share

Taxpayer Flight from MoCo, Part Three

By Adam Pagnucco.

In Part Two, we detailed how MoCo has experienced an exodus of taxpayer income since 1993.  But MoCo is not alone: many large jurisdictions in the Washington region have suffered from taxpayer flight over the last decade.

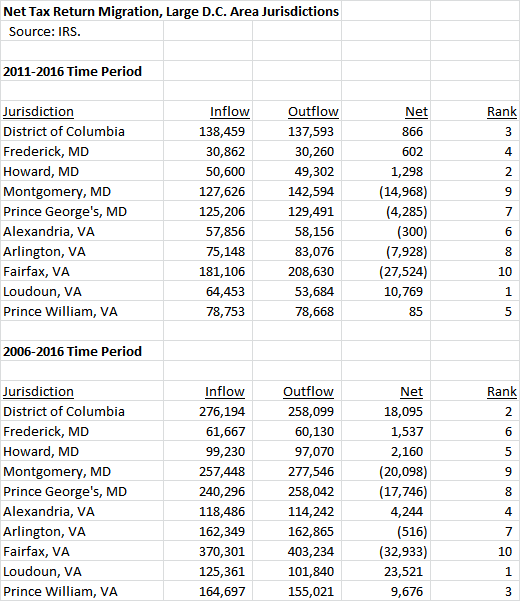
Below is a chart showing the net change in tax returns for the ten largest jurisdictions in the region.  We show net change for two time periods: the last five years (2011-2016), which include the recovery from the Great Recession, and the last ten years (2006-2016), which include the pre-recession peak, the recession itself and the recovery afterwards.  MoCo ranks nine out of ten in both periods with only Fairfax faring worse.  Loudoun is the only jurisdiction showing significant in-migration in the last five years while D.C. was comparable to Loudoun over the last ten years.

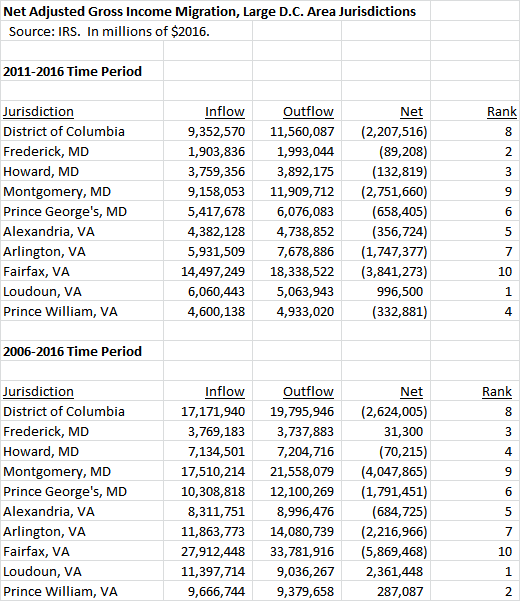
Next, we show the net change in adjusted gross income (AGI), measured in 2016 dollars, over the two periods.  Once again, MoCo is the second-worst jurisdiction in the region with only Fairfax trailing.  Notably, only Loudoun had a net inflow in the last five years and Loudoun, Prince William and Frederick had net inflows in the last ten years.

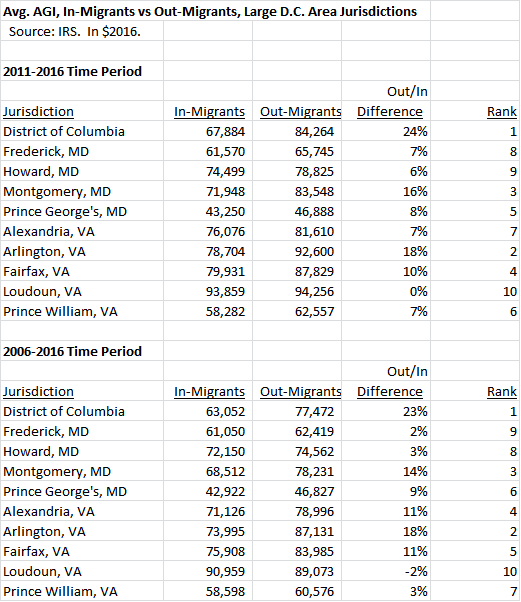
Finally, we show the average AGI of in-migrants vs the average AGI of out-migrants over the two periods.  In every jurisdiction except Loudoun (during the 2006-2016 period), in-migrant AGI was lower than out-migrant AGI.  MoCo’s gap was the third largest.

This is a bad picture for MoCo and not a very good one for the region as a whole.  What is going on here?

First, as has been previously noted by George Mason Professor Stephen Fuller, the entire Washington region’s economy has slowed down since the Great Recession.  That is reflected in the deterioration of the numbers above between the last five years and the last ten years.  The “new normal” has not been kind to anyone in this area and that includes MoCo.

Second, Fairfax has been affected by taxpayer income losses even more than MoCo.  Like MoCo, Fairfax is a huge county with huge bills to pay and nightmarish traffic congestion.  But Fairfax also shares a long land border with Loudoun, which has grown dramatically in past decades and is currently the nation’s wealthiest county.  Of the $5.9 billion that Fairfax lost to taxpayer flight in the last decade, $2.5 billion went to Loudoun.

Third, in addition to the number of taxpayers leaving on net, MoCo’s problem is the big gap in income between those coming in and those leaving.  One would expect to see such a gap in places like D.C. and Arlington, the two jurisdictions with the biggest income gaps shown above.  That’s because both places attract lots of young people who work in and near downtown D.C. and then move out when they earn more and have kids.  That explanation does not work well for MoCo, which has a much lower percentage of young people in its population than D.C. or Arlington.  And yet MoCo’s gap, which is third in the region, has been significantly bigger than the gaps in Fairfax and Howard, two jurisdictions of similar wealth, in the last five years.

We have seen how MoCo compares to its large neighbors in tax migration overall.  But what about direct inflow and outflow relationships?  To whom does MoCo lose income?  And from whom does MoCo gain income?  We will begin examining that in Part Four.

Share

Metro Ridership Still Falling

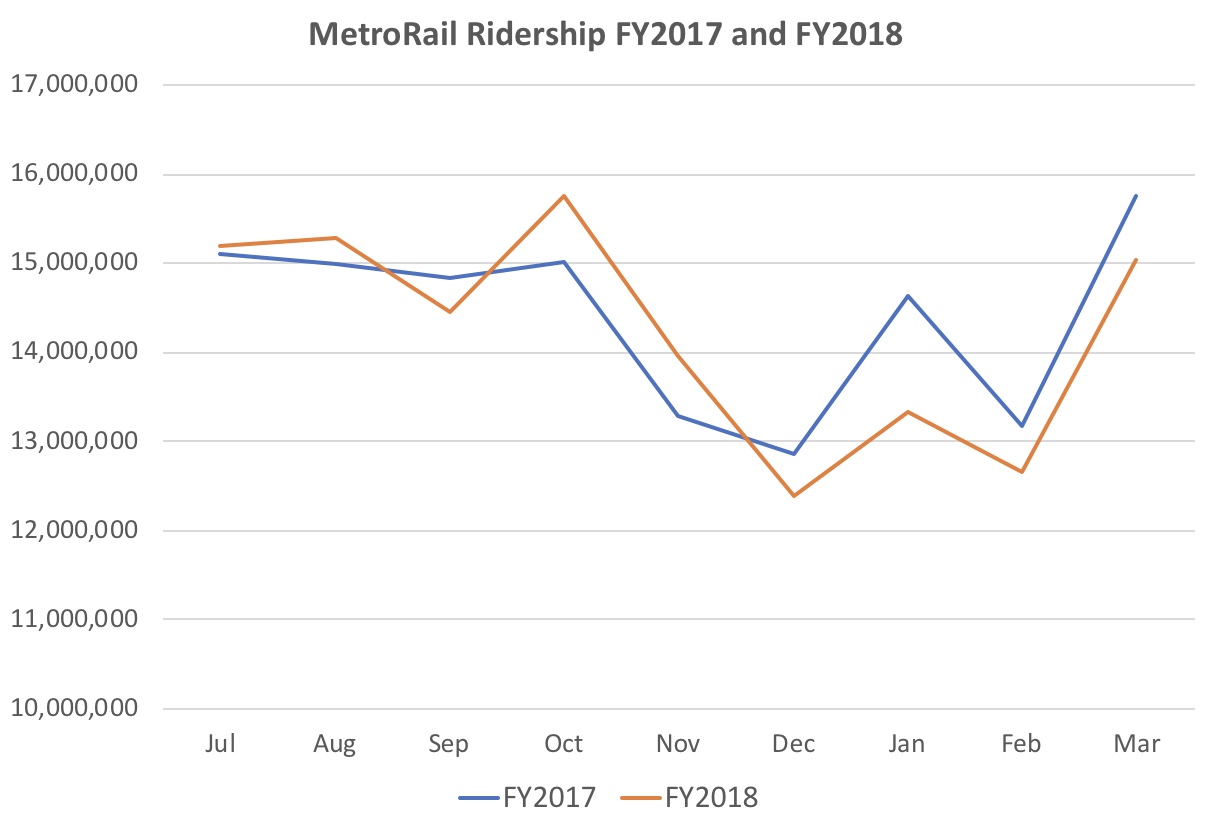
Today, I’ve put together MetroRail and MetroBus ridership over the same period from July though March for FY2017 and FY2018.

Among the nine months with comparable data, MetroRail ridership was up over the previous year in four months and down in five months. The months with decline, especially January, saw overall greater slump than the months with gain.

As a result, MetroRail ridership for more recent period is a net 1.57 million lower, or 1.2%, over the previous year. Metro should find this very discouraging. SafeTrack ended, at least temporarily, in June 2017, so the current year is completely post-SafeTrack. Its completion along with the “Back to Good” campaign has simply not halted the long-term hemorrhage.

Moreover, one can hardly blame the decline from December through March on a brutal winter this year. This planned closing of  stations in summer from 2018 through 2021 for weeks on end doesn’t seem likely to help matters either.

If you think the rail numbers are somewhat discouraging, take a look at the bus numbers.

MetroBus ridership is off by 8.6 million (!) over the previous year, an incredible decline 9.4%. No month saw a year-to-year increase. Declines in ridership impact Metro’s budget, as it depends on fares to provide a significant portion of its budget.

Data Sources: Vital Signs Report (Q1-2017), p. 21; Metro Performance Report (Q3-2018), p. 40.

Share

Maryland Politics Watch