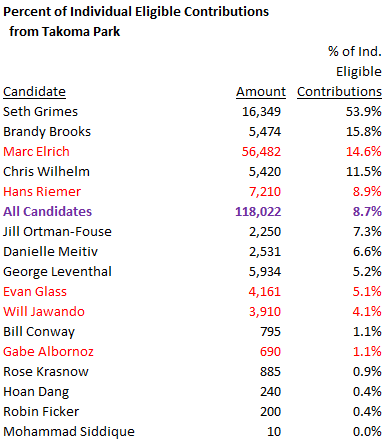
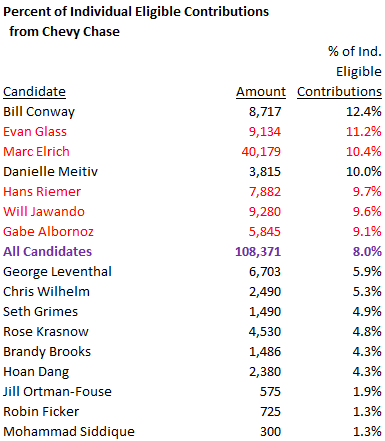
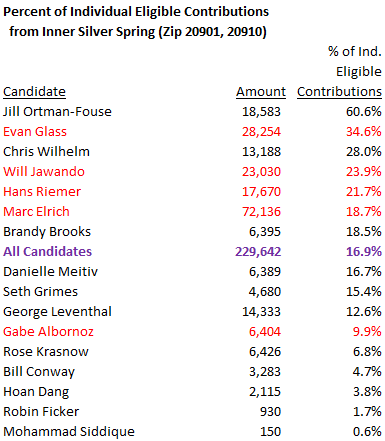
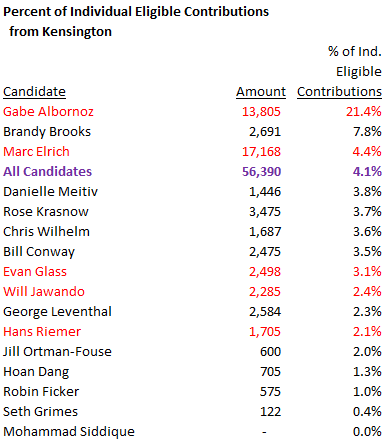
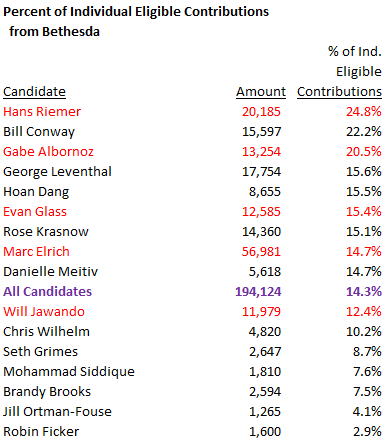
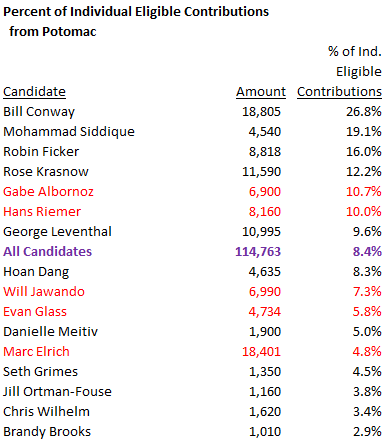
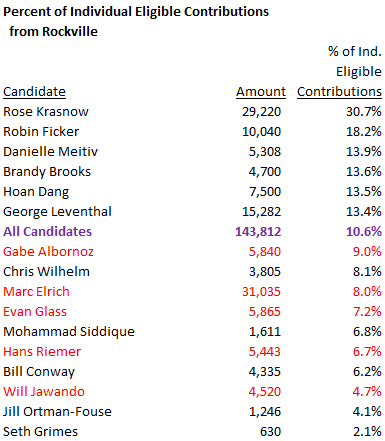
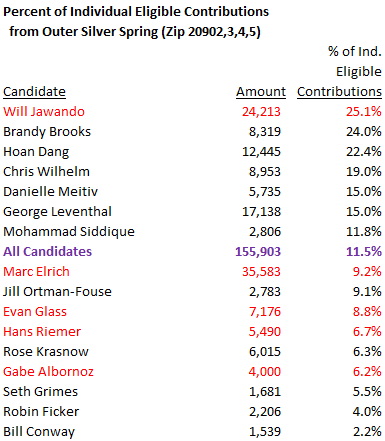
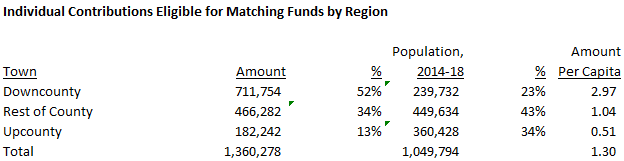
There were huge differences in public financing participation by geography in 2018. In some areas, residents donated significant amounts of money to publicly-financed candidates which were enhanced by matching funds paid out by the county. In other areas, residents contributed very little to publicly-financed candidates. These areas match existing patterns of political influence that were greatly amplified through distributions of matching public funds.
Let’s start with downcounty, hereby defined as the Democratic Crescent that sent Jamie Raskin to Congress. Downcounty is diverse in terms of demographics and economics but it is characterized by moderate to high turnout rates in Democratic primaries, high degrees of civic organization and lots of progressive activism.
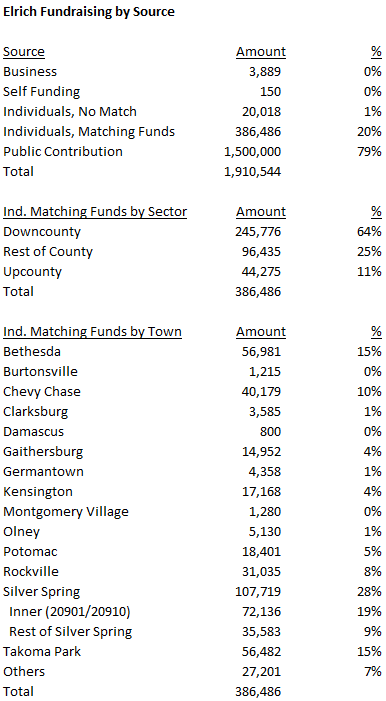
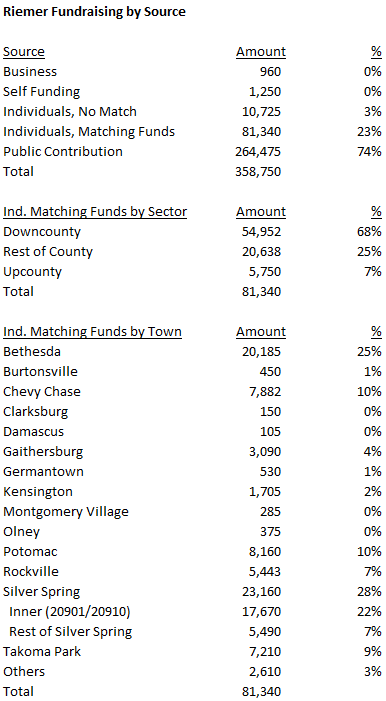
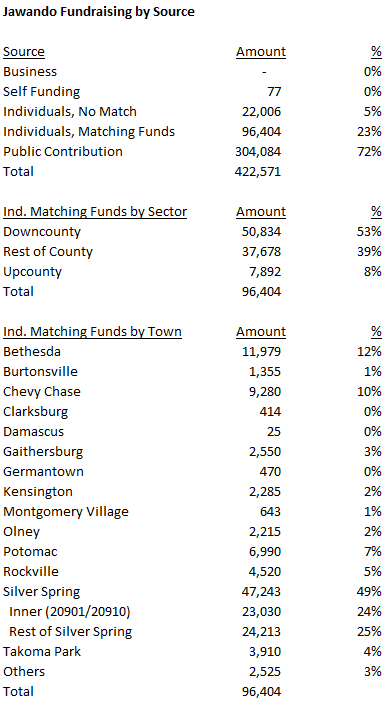
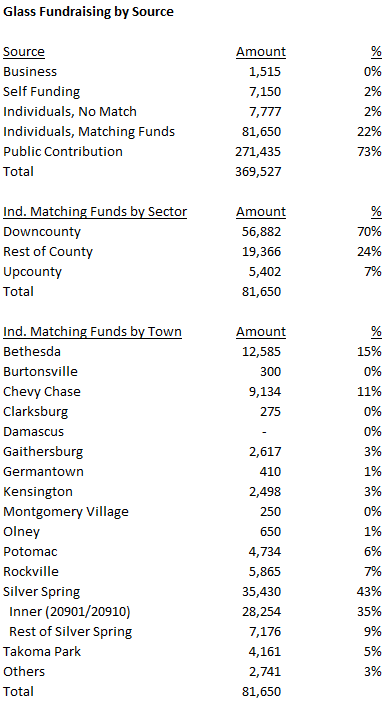
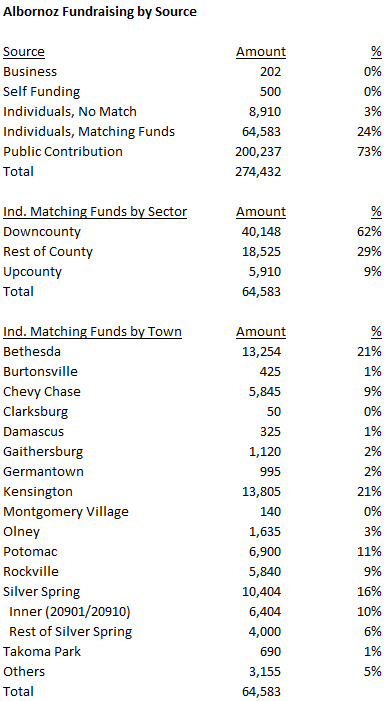
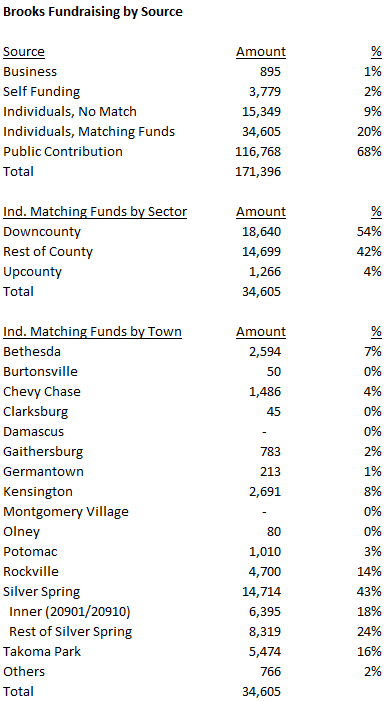
The downcounty areas shown below have two things in common. First, all of them exceeded per capita averages of individual contributions to publicly-financed candidates. Second, the winning candidates (Marc Elrich for executive and Hans Riemer, Will Jawando, Evan Glass and Gabe Albornoz for council at-large) tended to receive higher percentages of their campaign funding from these areas than most of the losing candidates. That makes sense – under public financing, fundraising and voting tend to go together. The tables below show amounts and percentages of fundraising by downcounty area for executive and council at-large candidates who qualified for matching funds. Winning candidates are shown in red.
All five downcounty areas participated a lot in public financing. Below are three populated areas located neither in downcounty nor in upcounty that had neither really high nor really low participation rates in public financing.
In Part Five, we shall see which areas disproportionately did not participate in public financing.
Elrich was a panelist at a forum held by the Housing Association of Nonprofit Developers on affordable housing on March 9. In response to a question from the moderator about the difficult economics of affordable housing, Elrich said this:
Part of me wonders whether we ought to be looking at not partnering with developers but just partnering with construction companies, where basically, here’s the – I want to build a building. What’s the price? I modified my own house, I have lots of experience in this. But I also did three tenant conversions in Takoma Park while I was a council member in Takoma Park and, you know, we took – there was no developer involved. We just looked at what’s the cost of the building, the units, what’s the cost of bringing in repair, and we dealt with it as a straight up transaction and we took anybody out of it who was going to take money out of the project in addition to the costs of just doing the physical work. And you know, it may be that we look more toward builders on a contract basis rather than developers. Because then I don’t have to deal with their rate of return.
You can see this at 1:25:37 of the video below.
Let’s remember that this was said not on a street corner or in a restaurant but during a forum for developers. One can reasonably assume that many of them heard the county executive loud and clear.
These remarks are problematic for two reasons. First, they fail to recognize what developers actually do. They don’t just oversee construction contractors. They analyze market economics; hire architects and engineers; design the project; obtain financing; go through land use, transportation and environmental reviews; negotiate with the community; market the property and/or hire agents to market it; manage the property or hire a property manager (if they continue to own it) and more. Construction contractors tend not to do those things, because if they did, they would be… developers. Eliminate developers from project development and who is going to do all of the above? County bureaucrats? Good luck in saving any money that way.
Second, it is totally banana cakes to publicly say that the county is looking to partner with a developer in White Flint and then to wonder out loud – in front of developers – whether the county should be partnering with developers at all. That’s right, developers, you are invited to partner with an elected official who believes that maybe you should not be on the project. Who is going to take that deal?
Anyone want to place any bets on when White Flint gets done?
In Part Two, we learned that downcounty accounts for less than one-quarter of the county’s population but comprised 52% of individual contributions eligible for matching funds to countywide candidates in 2018. Let’s look at the contribution geography of the candidates who won countywide offices and used public financing that year.
Marc Elrich
Elrich was a city council member in Takoma Park from 1987 through 2006 and an at-large member of the county council from 2006 through 2018. He was elected county executive for the first time two years ago. He raised more money in public financing than anyone else because of two factors: 1. county executive candidates have more generous matching formulas than council candidates, and 2. he had a competitive general election that necessitated more fundraising. In both the primary and the general, Elrich hit the matching funds cap of $750,000 for each election.
Elrich received $386,486 in individual contributions from county residents. Subject to the $750,000 caps, these contributions were eligible for public matching funds. Of the $386,486 in eligible contributions, 64% came from downcounty, higher than the all-candidate average of 52%. Elrich’s biggest sources of fundraising were inner Silver Spring (19%), Bethesda (15%) and Takoma Park (15%). Only 11% of Elrich’s eligible individual contributions came from upcounty.
Hans Riemer
Riemer has been an at-large council member since 2010. He was the only at-large incumbent who ran for reelection in 2018, a crucial advantage that helped him finish first in the primary. He is prevented by term limits from running for reelection to his current seat but he is free to run for other offices.
Riemer received $81,340 in individual contributions from county residents. Of these, 68% came from downcounty, higher than the all-candidate average of 52%. Riemer’s biggest sources of fundraising were Bethesda (25%), inner Silver Spring (22%) and Chevy Chase and Potomac (10% each). Only 7% of Riemer’s eligible individual contributions came from upcounty.
Will Jawando
Jawando ran for Delegate in District 20 in 2014 and he ran for Congress in District 8 in 2016. He finished second in the 2018 council at-large primary. Jawando raised more money than any other council candidate in public financing but has nonetheless chosen to use traditional financing in this cycle.
Jawando received $96,404 in individual contributions from county residents. Of these, 53% came from downcounty, about the same as the all-candidate average of 52%. Jawando’s biggest sources of fundraising were outer Silver Spring (25%), inner Silver Spring (24%) and Bethesda (12%). Only 8% of Jawando’s eligible individual contributions came from upcounty.
Evan Glass
Glass was a long-time civic leader who ran for the District 5 council seat in 2014 and barely lost to then-District 20 Delegate Tom Hucker. He finished third in the 2018 council at-large primary.
Glass received $81,650 in individual contributions from county residents. Of these, 70% came from downcounty, higher than the all-candidate average of 52%. Glass’s biggest sources of fundraising were inner Silver Spring (35%), Bethesda (15%) and Chevy Chase (11%). Only 7% of Glass’s eligible individual contributions came from upcounty.
Gabe Albornoz
Albornoz was the county’s director of recreation for 12 years and is a former chair of the county’s Democratic Party. He finished fourth in the 2018 council at-large primary.
Albornoz received $64,583 in individual contributions from county residents. Of these, 62% came from downcounty, higher than the all-candidate average of 52%. Albornoz’s biggest sources of fundraising were Kensington (21%), Bethesda (21%) and Potomac (11%). Only 9% of Albornoz’s eligible individual contributions came from upcounty.
Brandy Brooks
Brooks was a new resident in the 2018 cycle, having registered to vote in Maryland in April 2016. She picked up a number of important endorsements and ran a strong race, ultimately finishing seventh in the 2018 council at-large primary. Even though Brooks didn’t win, she is in this list because she is running again and is off to a fast head start.
Brooks received $34,605 in individual contributions from county residents. Of these, 54% came from downcounty and 43% came from Silver Spring. Despite receiving just 4% of her contributions from upcounty, Brooks finished fourth there with a second-place showing in Montgomery Village.
The five winning candidates for countywide office, all of whom used public financing, have two things in common. First, all of them received a majority of their in-county individual contributions from downcounty, which accounts for less than a quarter of MoCo’s population. Second, none of them received more than 11% of their in-county individual contributions from upcounty despite the fact that roughly a third of MoCo residents live in upcounty.
This is as good a demonstration of downcounty’s political influence as any.
In Part Four, we will begin looking at who led in fundraising in each of the county’s major population centers.
Congressman Jamie Raskin has spearheaded a joint letter from more than 100 members of Congress in both parties asking the IRS to extend its April 15 tax filing deadline. Among the reasons for the request are the agency’s late kickoff for tax filings, a change in the American Rescue Plan Act regarding taxation of unemployment benefits and the fact that the IRS is only answering 1 out of 4 phone calls from taxpayers with questions. The joint letter is reprinted below.
*****
Dear Commissioner Rettig and Acting Assistant Secretary Mazur:
We write to urge you to extend the impending April 15th federal tax filing and payment deadline. We welcomed the Internal Revenue Service’s (IRS) decision last year, after bipartisan calls from Congress, to provide an automatic filing and payment extension to July 15, 2020. Almost a year later, we are still grappling with the massive economic, logistical and health challenges wrought by this devastating pandemic. Millions of stressed-out taxpayers, businesses and preparers would appreciate an extension of the deadline to file their 2020 tax returns.
Over the past year, Congress enacted four historic emergency stimulus packages to deliver relief to Americans through Economic Impact Payments, the Paycheck Protection Program, and the Employee Retention Tax Credit. The American Rescue Plan Act of 2021, signed into law by President Biden on March 11, 2021, contained a provision excluding from income the first $10,200 of unemployment benefits received in 2020 for those with an adjusted gross income under $150,000. The IRS will need to take action to address the changes in the tax law, and taxpayers will need additional time to fully understand how this affects their tax liability. Further, taxpayers and tax return preparers are awaiting guidance from the IRS regarding these recent tax changes and are still waiting for some IRS forms to be made available for electronic filing. Compounding these complicating factors, the IRS did not begin the 2020 filing season until February 12, 2021, nearly three weeks later than usual, creating a lot less time for constituents and businesses to file taxes overall.
With limited in-person tax assistance at local tax preparation clinics, libraries, and community centers, tens of millions of our constituents are facing the same logistical hurdles as last year.
Additionally, the IRS is struggling to address taxpayer issues, with the agency reporting that it is answering only 1 out of 4 telephone calls. As our leaders on the House Ways and Means Committee have pointed out, compared with the same time last year, 27% fewer tax returns have been filed already and 31% fewer returns have been processed by the IRS.
For these reasons, we respectfully urge you to extend the federal tax filing and payment deadline as Americans, and the IRS, continue to grapple with the disruptions caused by the COVID-19 pandemic. Thank you for your thoughtful attention to this urgent matter.
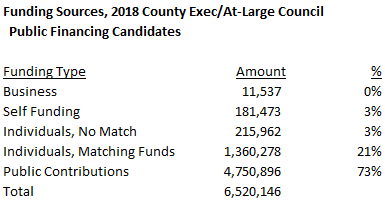
The table below summarizes the types of contributions received by the four candidates for county executive and the 25 candidates for county council at-large who enrolled in public financing in 2018.
Receipts from businesses primarily relate to refunds, especially deposit refunds. They show up in public financing reports as contributions, but they are not true contributions in that they don’t add net financial value to campaigns. Self-funding of up to $12,000 (including money from spouses) is allowed for publicly financed candidates. Money received in the “individual, no match” category comes from individuals who live outside the county. Under the county’s public financing system, their contributions are not eligible for public matching funds. Money received in the “individual, matching funds” category comes from county residents. Their contributions ARE eligible for public matching funds. Finally, money received in the “public contributions” category are public matching funds. In 2018, 94% of all money received by publicly financed politicians came from individual contributions eligible for matching funds plus the matching funds distributed for them.
Because public matching funds are distributed through a formula tied to eligible individual contributions from county residents, it is the latter that is key to determining overall fundraising for publicly financed politicians. The more individual contributions from county residents, the more public matching funds the politician receives (subject to caps). As seen above, there are no other major sources of money available to candidates in public financing.
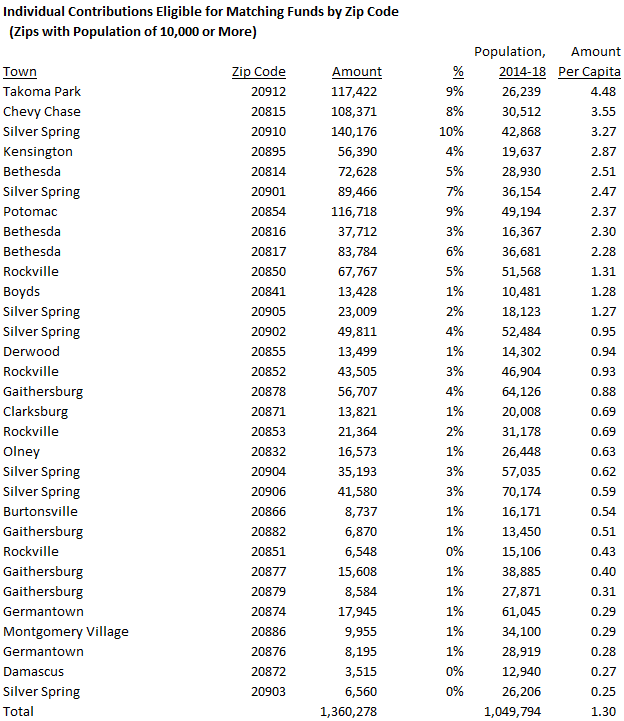
Now let’s look at where individual contributions from county residents that are eligible for public matching funds come from. The table below shows their distribution for each zip code with more than 10,000 residents. Again, this includes individual contributions from county residents to executive and council at-large candidates but not district council candidates (since they would skew the geography).
The average eligible individual contribution per capita was $1.30. In terms of per capita contributions, the top six zip codes, as well as eight of the top nine, were in downcounty. Takoma Park led the way at $4.48 per capita, more than three times the county average. (It’s probably not a coincidence that Marc Elrich, the top fundraiser in public financing and the winning candidate for county executive, is a long-time resident and former city council member in Takoma Park.) Six of the bottom seven zip codes in per capita contributions were in upcounty. The exception was zip code 20903, which has one of the lowest average household incomes in MoCo.
The table below summarizes individual contributions from county residents that are eligible for public matching funds by region.
According to the U.S. Census Bureau, downcounty accounts for less than a quarter of the county’s population. However, downcounty donated 52% of individual contributions eligible for matching funds in 2018. Upcounty accounts for about a third of the county’s population but donated less than one-seventh of individual contributions eligible for matching funds in 2018. In per capita terms, downcounty residents contributed $2.97 each to publicly financed candidates, almost six times the per capita amount contributed by upcounty residents (51 cents).
It’s really no contest. Downcounty dominated public financing in 2018. Upcounty lagged badly.
In Part Three, we will discuss the fundraising geography of individual candidates.
When Montgomery County passed public financing more than six years ago, many predictions were made. Public financing was supposed to empower small donors. (It did.) It was supposed to draw in more candidates for office. (It did.) It was supposed to reduce the influence of “special interests.” (That’s debatable.) But one of its biggest impacts was something no one predicted because it wasn’t on anyone’s radar when it was passed:
Public financing has amplified the political influence of downcounty.
In this series, we are going to investigate the geography of political contributions made in the county’s public financing system. That’s important because just as politicians pay special attention to the sources of their votes, they certainly pay special attention to the sources of their campaign contributions. Knowing where the money comes from greatly aids the understanding of our political system and public financing is no exception.
First, let’s discuss methodology. This series looks at public financing contributions to 2018 candidates for county executive and county council at-large. It excludes candidates for district council seats because their contributions naturally skew towards their districts. Of particular interest are individual contributions that are eligible for public matching funds. (We’ll explain more about this below.)
In terms of geography, we will look at towns, zip codes and two regions: downcounty and upcounty. Downcounty is defined as the “Democratic Crescent,” a term I coined that includes Takoma Park, Silver Spring (inside the Beltway), Chevy Chase, Kensington, Bethesda, Glen Echo and Cabin John. Because there are thousands of individual contributions, I am using zip codes 20901 and 20910 as proxies for Silver Spring inside the Beltway. Upcounty is defined as Ashton, Barnesville, Boyds, Beallsville, Brookeville, Clarksburg, Damascus, Dickerson, Gaithersburg, Germantown, Laytonsville, Montgomery Village, Olney, Poolesville, Sandy Spring, Spencerville and Washington Grove. Lots of communities, including but not limited to Rockville, Potomac, Wheaton, Glenmont, Burtonsville and most of East County are in neither downcounty nor upcounty.
Public financing changes fundraising incentives for politicians. Those who use traditional financing are interested in big checks, whether they come from PACs, businesses, wealthy people or self-funding. Those who use the county’s public financing system (it’s voluntary) are interested in individual contributions from county residents, with the allowable maximum at $250. (The maximum was $150 in the 2018 cycle.) That’s because the county will match individual contributions from residents of up to $150 on a sliding scale, with smaller contributions getting a larger percentage match. Public financing participants can collect individual contributions from non-county residents but those will not get public matching funds. Public financing participants can’t collect contributions from PACs, unions, businesses or other non-individual sources but they can give themselves up to $12,000 in self-funded seed money. (That amount includes money from a spouse.)
And so publicly financed politicians raise money by collecting lots and lots of small checks from county residents and getting public matching funds for them. Those matching funds are capped depending on which office the candidate is seeking and they are only available when certain thresholds of individual contributions are reached. All of this means that it’s really important that publicly financed candidates come into contact with lots of county residents who are going to write checks, even small ones. They will go wherever they think such residents are located. They will hold whatever events are necessary to attract them. They will ask surrogates to round them up on their behalf. And if certain communities don’t contribute as much money and/or don’t fit the politician’s electoral strategy, the politician will spend less time there. From a fundraising perspective, what’s the point of talking to people who either can’t or won’t write checks that can be matched with public funds?
President Joe Biden and Democrats in Congress passed a mammoth economic stimulus plan last week. The plan contains hundreds of billions of dollars in aid to states and local governments. How much of that is coming to Maryland?
According to U.S. Senators Ben Cardin and Chris Van Hollen, a LOT.
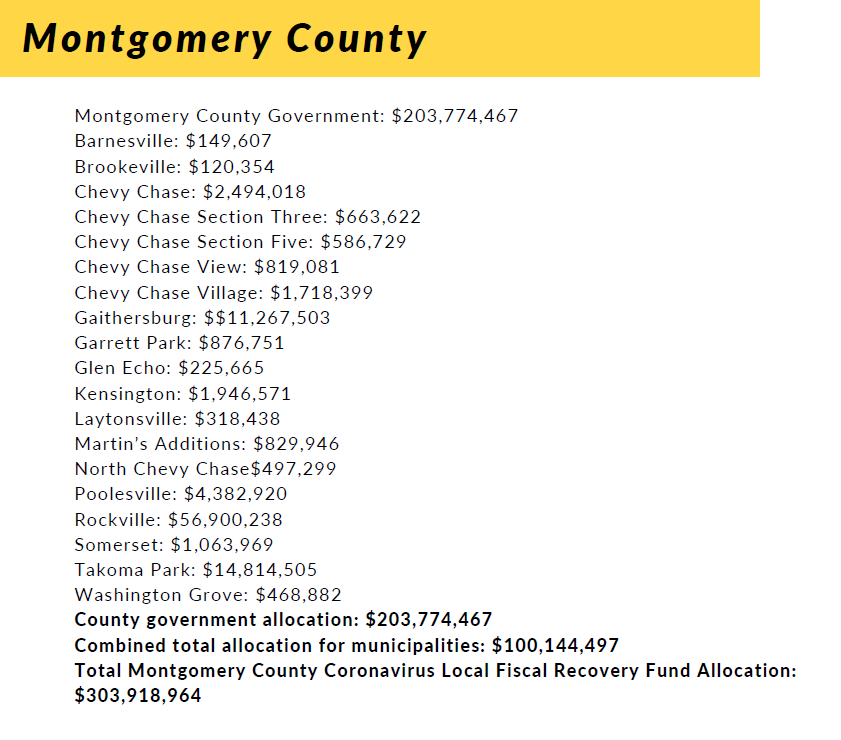
Cardin and Van Hollen estimate that Maryland and its local jurisdictions will receive a total of nearly $6.4 billion, with the state getting $3.9 billion, the counties getting $1.2 billion and municipalities getting $1.1 billion. The money can be used to respond to or mitigate the COVID-19 health emergency or its negative economic impacts, including assistance to households, small businesses, nonprofits, and aid for tourism, travel, and hospitality; provide essential workers with premium pay; cover revenue loss as a result incurred as a result of the COVID-19 emergency; or to make necessary investments in water, sewer, or broadband infrastructure. The money cannot be used to support any pension fund or offset a tax cut.
The table below shows the estimated distribution of funds by county.
The table below shows the estimated distribution of funds for MoCo and its municipalities.
This doesn’t solve all of MoCo’s budget problems, especially the issues connected to the county’s long-term lack of competitiveness in the region. But it should help the county balance its budget without raiding reserves or retiree health care so long as it practices some spending restraint. One mistake that the county should not make is to use this one-time funding to initiate new indefinite, long-term spending. This federal money, while welcome, is temporary.
The executive’s recommended budget comes out later today.
A majority of MoCo’s state legislators have written to the Maryland Transit Administration (MTA) opposing County Executive Marc Elrich’s proposal to single track the Purple Line through a tunnel in Downtown Bethesda. In the letter, signed by 5 of MoCo’s 8 state senators and 15 of MoCo’s 24 delegates, the lawmakers “strongly urge” that MTA adhere to its “previously approved” plan to build two tracks in the Purple Line tunnel. The letter is reprinted below.
*****
March 9, 2021
Mr. Kevin B. Quinn, Jr. Administrator Maryland Transit Administration 6 Saint Paul Street Baltimore, Maryland 21202
Dear Administrator Quinn:
We are writing to strongly urge the Maryland Transit Administration’s continued commitment to the planned Bethesda Purple Line Station and operations in and out of that station as previously approved. It is important to our Montgomery County constituents that the Capital Crescent Trail (CCT) be rebuilt beneath Wisconsin Avenue as promised and that the Purple Line’s operations are not adversely impacted.
The CCT Tunnel—previously known as the Air Rights Tunnel—is an important part of our region’s multi-modal transportation infrastructure. From 1998 until its closure for Purple Line construction, it was a major bicycle commuting route utilized by thousands of Marylanders each day. Local bicyclists and other trail users were repeatedly assured that the CCT would be rebuilt below ground to ensure this vital pathway remained safe and uninterrupted. Indeed, many bicyclists strongly advocated for the Purple Line because of the thoughtful, forward-looking plan that allowed both the transit line and a safer trail.
As for the Bethesda Station, the Purple Line has been under study since 1992 and project plans were approved long ago. Construction of this transformative project is, as you know, well underway. As such, we encourage MTA to uphold its commitments to our constituents by implementing the existing, two-track plan for the Bethesda Purple Line Station and accompanying operations. The two-track plan allows us to meet the full potential of the Purple Line: rapid travel times, short headways, and reliable boarding.
We recognize that Montgomery County has a significant role to play to fund and build the below ground CCT. And we appreciate the substantial commitment our County has already made in bringing the Purple Line and the replacement Capital Crescent Trail this far. But we also need MTA to reject major mid-construction changes to infrastructure and, ultimately, operations.
Such changes may lead to some short-term savings but they will only harm the Purple Line’s success in the long-run. To the extent, however, that the currently pending process of selecting a new design-build contractor for the project can be used to reduce the cost of the underground Capital Crescent Trail and the two-track plan in collaboration with the county, we welcome such efforts.
Thank you for your consideration of our request.
Sincerely,
Senator Brian J. Feldman Senator Benjamin F. Kramer Senator Susan C. Lee Senator William C. Smith, Jr. Senator Jeff Waldstreicher Delegate Kumar P. Barve Delegate Charlotte Crutchfield Delegate Kathleen M. Dumais Delegate Jim Gilchrist Delegate Ariana B. Kelly Delegate Marc Korman Delegate Lesley J. Lopez Delegate Sara Love Delegate David Moon Delegate Julie Palakovich Carr Delegate Lily Qi Delegate Kirill Reznik Delegate Emily Shetty Delegate Jared Solomon Delegate Jheanelle K. Wilkins
cc: Matthew Pollack, Executive Director, Maryland Transit Administration
Part Two of Goucher College’s latest poll of Marylanders is out and one of the questions it asks is this: “Do you [support or oppose] making marijuana legal for recreational use in Maryland?” Here are the results on this question from the poll’s crosstabs. The margin of error is 3.8% for all voters and is higher for subsamples.