Tag Archives: Latinos

Maryland Latinos Hit Hard by COVID-19

By Adam Pagnucco.

While the COVID-19 crisis has affected virtually everyone in the nation, it has not affected everyone equally. In a project for the Council for Advocacy and Policy Solutions, I analyzed COVID-19 infection rates by Maryland zip code to determine which demographic and economic factors were most associated with the spread of the virus. Many factors had some correlation, but none of the ones I examined had more of a correlation with COVID-19 than the Latino percentage of population.

For each of the more than 400 zip codes in Maryland, I collected the following data:

COVID-19 cases on 6/18/20
Average total income per tax return
Population per square mile
Median age
Percent Hispanic (any race)
Percent white non-Hispanic
Percent black
Percent Asian
Percent of population age 25 and older with less than high school graduate level of education
Percent of population age 25 and older with graduate and/or professional degree
Percent of population age 5 and older who speak a language other than English at home

I then used four techniques to identify correlations between each of these factors and the number of COVID-19 cases per 1,000 residents.

5 category comparison
For each factor, five categories ranging from low to high were measured. For example, for median age, COVID-19 cases per 1,000 residents were estimated for median ages of under 35, 35-39.9, 40-44.9, 45-49.9 and 50 or older.

Correlation coefficient
A correlation coefficient measures the correlation between two variables. A coefficient of 1.0 means that the two are perfectly and positively correlated. A coefficient of -1.0 means that the two are perfectly and negatively correlated. A coefficient of 0.0 means that the two are uncorrelated.

R-squared
R-squared measures the percentage of variation in one variable explained by the variation of a second variable. An R-squared of 100% means that 100% of the variation in one variable is explained by variation of a second variable. An R-squared of 0% means that 0% of the variation in one variable is explained by variation of a second variable. Unlike the correlation coefficient, R-squared cannot be negative and therefore does not indicate whether the correlation between two variables is positive or negative.

X-Y chart
Each data point is plotted on a chart with the x-axis representing one variable and the y-axis representing another. A line of best fit is also shown summarizing the correlation between the two variables.

Among the factors I studied, none had a stronger correlation with infection rate by zip code than the Hispanic/Latino percentage of the population. The summary table appears below.

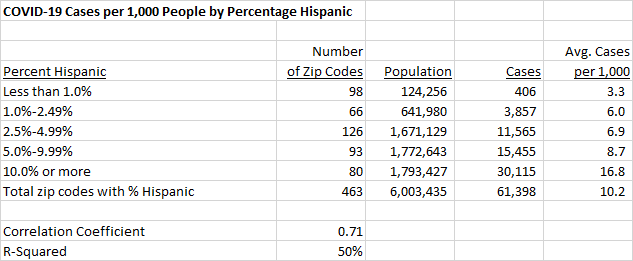
As the Hispanic percentage of the population rises, so too does the infection rate. Maryland zip codes in which Hispanics account for 10% or more of the population had infection rates roughly five times greater than zip codes in which Hispanics accounted for less than 1% of the population. Overall, roughly half of the variation in infection rates among Maryland zip codes was explained by Hispanic percentage alone.

The chart below shows the distribution of zip code data points. The vertical axis plots the number of COVID-19 cases per thousand residents as of 6/18/20. The horizontal axis plots the Hispanic percentage of each zip code’s population. The association is not perfectly linear but the trend is plain.

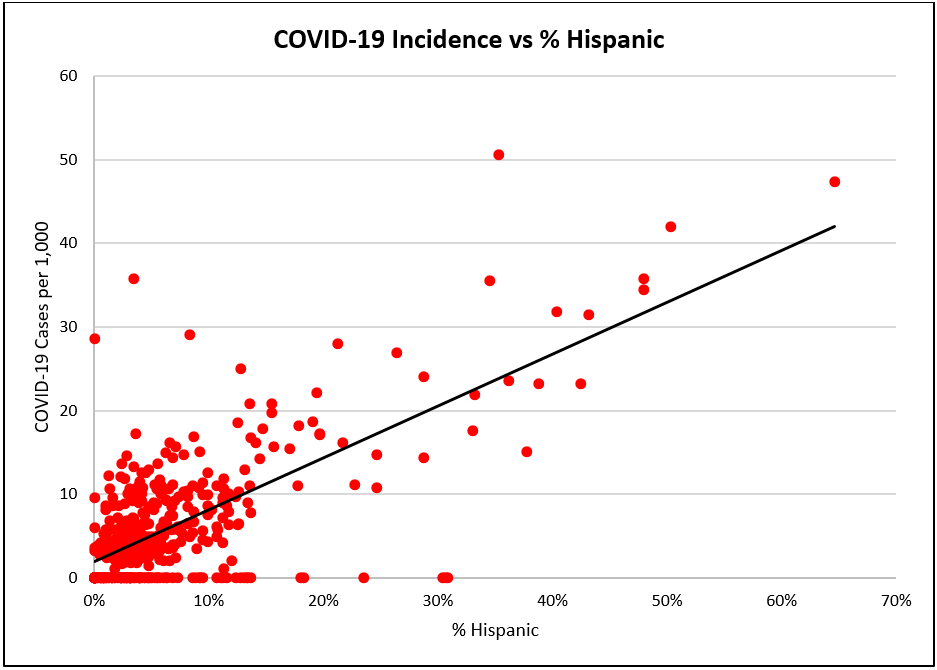
The data do not demonstrate why this association exists. A possible reason might be heavy Latino presence in essential sectors like agriculture, food manufacturing, grocery stores, warehouses and delivery, all of which have heightened risks of virus exposure. Relatively low health insurance coverage exacerbates the issue.

The second highest correlation I found with infection rates was the percent of population age 5 and older who speak a language other than English at home. This factor is closely associated with the Hispanic population percentage.

Many of the other factors I examined had some correlation with infection rates although none of them were quite as strong as percentage Hispanic. This has a clear implication for policy makers: dealing with COVID-19 requires special attention to this demographic. If the virus spreads unchecked in this community, no other community will be safe.

The entire study, including results for other factors, can be found here.

Share

Why Trump Will Lose, Pt. III: The Future is Now

Over the past two weeks, we’ve seen how Republicans fear and loathe America’s diverse future, while Democrats embrace it. Four years ago, the Republicans issued a report arguing that they needed to make their peace with immigrants or continue riding the waves to political oblivion. Bad news for the Republicans: the future is now.

Here is the estimated Latino vote for President nationally and in selected states in 2012. The source is an election eve poll from Latino Decisions, the nation’s premier pollster of Latino voters:

LD by StatePew reports that the Latino electorate will by 17% bigger in 2016 than in 2012. In concrete terms, this means that there will be 3.97 million more eligible Latino voters. This exceeds the 3.22 million increase in the much larger white population. So the Republican political imperative to grab a higher share of the Latino vote only continues to grow.

Just in case you missed it, Trump went after immigrants not just from Mexico, source of roughly 60% of Latino immigrants, but also all of Latin America in his opening announcement:

Again, he has not shied away from demonizing immigrants throughout the campaign. His infamous wall that Mexico will pay for (does he know we already have walls along much of the border?) is his one concrete policy proposal. Trump’s speech at the RNC despicably singled out the highly vulnerable population of 11 million undocumented immigrants as the source of American crime:

Nearly 180,000 illegal immigrants with criminal records, ordered deported from our country, are tonight roaming free to threaten peaceful citizens. . . .

One such border-crosser was released and made his way to Nebraska. There, he ended the life of an innocent young girl named Sarah Root. She was 21 years-old, and was killed the day after graduating from college with a 4.0 Grade Point Average. Her killer was then released a second time, and he is now a fugitive from the law.

I’ve met Sarah’s beautiful family. But to this Administration, their amazing daughter was just one more American life that wasn’t worth protecting. One more child to sacrifice on the altar of open borders. What about our economy?

As it turns out, immigrants commit crimes at lower rates than other Americans. For some reason, undocumented immigrants would rather avoid the authorities. Go figure.

These attacks on immigrants are particularly damaging because so many Latinos live in mixed status families. Even Latinos who don’t see these tactics as demonization of them as a group. We’ve seen the political effect of this in the past.

The Pete Wilson Effect

When Republican California Gov. Pete Wilson ran this ad attacking immigrants sneaking over the border and supported anti-immigrant Proposition 187, the share of Latinos newly registering as Republicans dropped dramatically:

For those who don’t remember the days of yore, California voted Republican in every presidential election from 1968 through 1988. Now, it is a safe Democratic state and Republicans don’t even bother. Pete Wilson’s tactics rendered the largest state in the Union a noncompetitive Democratic bastion.

The Power of the Latino Vote

Latino Decisions has helpfully outlined just how bleak the demographics are for Republicans in a series of figures that estimate the share of the Latino vote that Trump would need to win in 2016. The first shows the worst case for the Republicans, as it assumes that turnout rates among all demographic groups remain unchanged from 2012 and that support rates among non-Latino groups for the Republicans also remain the same.

LDSlide1Trump would need 52% of the Latino vote–far higher than the share of the Latino vote than George W. Bush, who was pro-immigration reform and spoke positively of Latinos, received. In the words of George H.W. Bush and Dana Carvey, he’s not gonna do it:

Republicans, however, have hopes that the electorate will vote differently than 2012. In Scenario 2, Latino Decisions looks at the share of the Latino vote that Trump will need assuming that African-American turnout and Democratic support declines to pre-Obama levels:

LDSlide2Trump would still need 47% of the Latino vote. Cue laugh track.

Latino Decisions Scenario 3 is the most hopeful for Trumpistas. In addition to a decline in black turnout and Democratic support, it assumes that the Latino vote grows at a slower rate than expected and that whites vote as solidly for Trump in 2016 as they did for Republicans in the banner midterm election of 2014:

LD Slide 3Even under this optimistic scenario, Republicans still need 42% of the vote. Mitt Romney got just 23%. Anyone wanna bet that Tweety McOrange is going to do better than Mittens?

Share

Why Trump Will Lose, Pt. II

Unlike Asian Americans, so many pixels have already been spilled on the hate-hate relationship between Trump and Latinos. Today’s post attempts to take a deeper dive into why Trump’s total alienation from Latinos dooms his presidential bid in Florida.

Florida was long viewed as very safe Republican turf before it morphed into the ultimate swing state in 2000. Long term trends combined with Trump’s anti-Latino vitriol will heave the state more strongly towards Team Blue.

Cuban Americans

Anti-Communist Cuban voters have long provided crucial support to Florida’s Republican Party. Those days, however, are rapidly coming to an end, as this chart from Pew shows:

CubansFL1

Why is this happening? For a start, young Cuban Americans are much more Democratic than their elders. In contrast to those who fled the Castro dictatorship in the 1960s, young people and more recent arrivals take a more nuanced view of relations with Cuba. Two-thirds under age 49 now oppose the American embargo and Obama’s decision to normalize relations with Cuba has net support of +20 among Cuban Americans of all ages.

Trump is also incredibly unpopular among Cuban Americans:

Donald Trump is the catalyst who could force a decisive break between Miami-Dade County’s influential Cuban-American voters and the Republican Party, a new poll has found.

Local Cuban Americans dislike Trump so much — and are increasingly so accepting of renewed U.S.-Cuba ties pushed by Democratic President Barack Obama — that Trump’s likely presidential nomination might accentuate the voters’ political shift away from the GOP, according to the survey shared with the Miami Herald and conducted by Dario Moreno, a Coral Gables pollster and a Florida International University associate politics professor.

Thirty-seven percent of respondents supported Trump, a number that is still higher than the 31 percent who backed Clinton — but also “the lowest in history that any potential Republican candidate polls among this traditionally loyal demographic,” according to Moreno.

By the way, Moreno is the demographic–he’s a Republican Cuban American who won’t vote for Trump.

Puerto Ricans

Beyond the strong Democratic trend among Cuban Americans, the share of Cuban Americans among all Latinos has been declining at the expense of much more Democratic Latino groups. Indeed, Cuban Americans now form less than one-third of Florida Latinos:

FL Latinos 2The share of Puerto Ricans has risen rapidly with many settling in the Orlando area. Due to the economic crisis on the island, a stunning 9.1% of its residents have left for the mainland from 2005 to 2015. Florida’s Puerto Rican population now rivals New York’s.

Puerto Ricans are American citizens and can vote in presidential elections the moment they move to the mainland. And they are an extremely Democratic constituency, as are the other non-Cuban Latinos in Florida.

The Overall Impact

Pew’s statistics also reveal that share of Democrats has been rising more broadly due to the shift among Cuban Americans and the rise of other Democratic-leaning Latino constituencies:

FL Latinos1

On the whole, Florida Latinos really don’t like Donald Trump. Among the entire group, Latino Decisions reports that 84% have an unfavorable view of the Donald, as compared to just 12% who like the orange guy with the club in Palm Beach.

Overall Impact

Latino Decisions estimates that Trump needs 47% of the Latino vote to carry Florida:

Scenario-Florida

Does anyone think Trump is going to get anywhere near this figure? Even if his share of the white vote rises, strong Latino support gives Clinton a nice cushion.

Share