How Will Turnout Matter This Election Cycle?

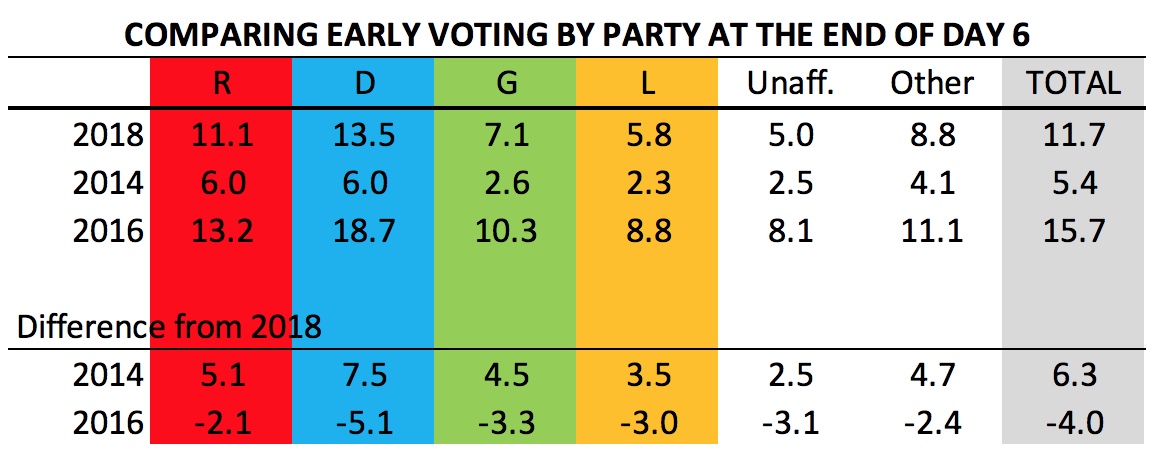
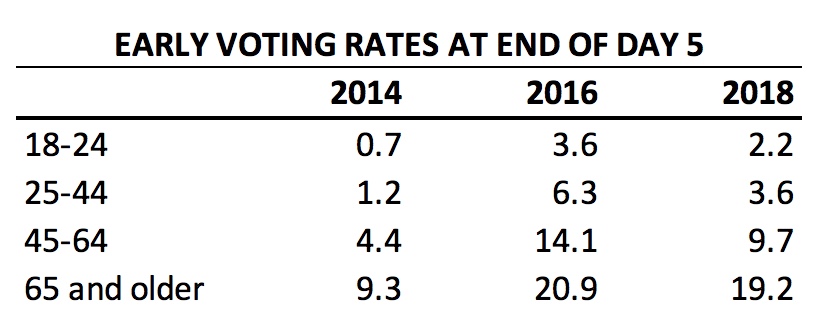
I’ve been covering who has been turning out in early voting heavily the past few days. There is little evidence of a wave of young voters turning out that will carry the Democrats to victory. At the same time, the electorate looks much improved for Democrats from 2014 even if it is not showing signs of being as favorable to them as the 2016 presidential electorate.

Of course, we won’t know the complete picture about how turnout has changed from either 2014 or 2016 until all the votes have been cast. But it seems important to take a moment to pause from statistics to  consider when and how turnout dynamics matter.

Turnout Won’t Matter in the Governor’s Race

Based on the polls, Ben Jealous is in dire trouble. In a future post, I hope to explore why Jealous is flailing despite Maryland’s favorable demographics that should be even more favorable due to shifts in voting behavior unleashed by Trump in a future post. In a nutshell, he losing far too much of the Democratic base.

Anthony Brown fared poorly among white voters four years ago. Ben Jealous looks set to do even worse even as Democrats elsewhere look poised to make substantial gains among highly educated women. Equally problematic, he is hemorrhaging support among nonwhite voters.

Even the most favorable Democratic turnout wind cannot save Jealous from these fundamental problems. They could help close the gap with Hogan but that would merely serve to make his loss somewhat more respectable. But there is no way that Jealous can win the election if he loses roughly 30% of Democratic voters as polls currently indicate.

Who Votes Matters More Down Ballot

Republicans are hoping that there will be a Larry Hogan wave that gives them enough seats in the General Assembly to uphold his veto in at least one house. They’ve focused particularly hard pm the Senate in their “drive for five.”

Except to my surprise in our polarized era, voters seem quite inclined to split their tickets. The same polls that show Larry Hogan receiving a vote share in the high 50s reveal similar proportions wanting Democrats to control the legislature.

In 2014, the Republicans picked up the low hanging fruit in several districts that had long leaned more Republican in national elections and became even more so with Trumpian populism. But there were simply enormous gaps in support for Hogan and Republican legislative candidates elsewhere.

That pattern could easily appear again in 2018. Gov. Hogan has framed this election as a vote to maintain what he presents as our much improved status quo and that he works well with the legislature. That’s hardly an argument to throw out Democrats in the General Assembly.

Republicans are hoping that better candidates and huge financial investments will change this dynamic. But Democrats who defect for Hogan may not be so quick to do so when presented with different candidates. Democrats who think Hogan is fine or Jealous has too many unrealistically expensive plans will often find their local Democratic candidate better attuned to their patch and deem the Republican too right wing.

In Senate races with Democratic incumbents fighting a tough battle for reelection, such as Ron Young in Frederick or Kathy Klausmeier in Baltimore County, a more favorable electorate could provide them with a crucial cushion.

It could also make a difference in the many exciting county executive races and help, for example, carry Johnny Oleszewski into office in Baltimore County. The races in Howard and Anne Arundel have also tightened, though it’s unclear how much. If Democratic challengers can get within a few points, a more favorable electorate could open the door to an upset. It won’t be enough to overcome a spread that looks more like 55-45.

In short, this year, turnout dynamics look likely to have the potential to play a crucial difference around the margins but the candidates have to get close enough for the margin to make a difference.

Share

Blue Wave or Not? Comparing Early Voting Turnout with the Past

Democrats remember 2014 in which lassitude among their core voters helped propel Larry Hogan into office. They’re hoping that the electorate will look more like 2016 in which Hillary Clinton carried the state by a large margin.

Using data from the State Board of Elections, the above table presents the percentage of people by party who took advantage of early voting at the end of the sixth day. It also shows changes from both 2014, the previous gubernatorial election, and 2016, the presidential election.

The statistics suggest that the 2018 electorate is unlikely to resemble closely the 2014 electorate. Democrats are joyful that early voting turnout is up a full 6.3% from 2014. Even better for Team Blue, Democratic turnout is up by even more at 7.5%.

Republicans are also turning out 5.5% higher but the lower increase means that the GOP has fallen behind. While Democratic and Republican turnout at this point in early voting was equal in 2014, Democrats have pulled into the lead this year.

Comparisons with 2016 are less favorable for Democrats. Early voting turnout  this year is 4.0% down from 2016. Democratic turnout is down by even more at 5.1%. Republican turnout has decreased much less at 2.1%. However, Republicans start from a much lower base as the EV electorate in 2016 was much more lopsidedly Democratic in that year than in 2014.

The bottom line is that the early voting electorate this year is much more favorable to Democrats than 2014. But it’s also not nearly as favorable to them as the 2016 electorate.

Of course, we have to wait and see the impact, if any, on total turnout. Early voting can simply replace Election Day voting. Nevertheless, the idea suggested by the data that total turnout will end higher than 2014, not a banner year for voting or when Trump polarized and mobilized people, but not reach presidential year turnout is intuitively appealing.


Share

Early Voting Skews Democratic and Female

In previous posts, I’ve presented evidence that there is no wave of youth voters showing up at early voting. While this doesn’t comport with Democratic theories that young Marylanders will propel them into office in a wave, there is other good news for Democrats.

Democrats Out Participating Republicans

First, Democrats are participating at higher rates than Republicans in early voting in all but two counties in the state:

The statewide gap in participation between the two major parties is 2.4%. However, it is much wider in some jurisdictions. In Montgomery, Democrats are showing up a full 5.6% more than Republicans. The gap in Howard is 5.2% and in Baltimore City is 5.1%.

Democrats in Kent, Prince George’s and Frederick also have high participation rates relative to Republicans with gaps of 4.9%, 4.2%, and 4.1% respectively. Anne Arundel Democrats lead their Republican counterparts by 3.5%.

In contrast, Republicans are narrowly out participating Democrats in Caroline and Somerset. The latter has long had weak Democratic participation relative to the potential strength of the party in this county with a sizable African-American population.

Finally, note that unaffiliated voters (i.e. independents) are participating at lower rates than members of either major party in every jurisdiction throughout the state. Overall, their turnout rates are less than half as strong as either major party.

Why the lower rates? First, major parties have organizations trying to get their voters to the polls. Second, independent voters just tend to be less interested in politics and less likely to vote.

Women Out Participating Men

As of last night, women composed 57% of all early voters, while men were just 43%. People with no gender marker in their voter file comprised 0.06% of all early voters.

These statistics are more like what one might expect to see in a Democratic primary where women often compose around 60% of the overall electorate. They provide further evidence of the Democratic lean of early voters. Trump has exacerbated the already wide gender gap in partisanship and voting behavior.

If 2016 seemed to be ultimately all about angry men lining up behind Trump, early voting in 2018 is thus far about motivated women.

Share

Early Voting & Returned Absentees Across Maryland

Today, Seventh State expands its coverage of pre-Election Day voting to include returned absentee ballots as well as early voting. Yesterday was the biggest day so far for early voting as 91,480 voters across the state went to early voting centers.

At the end of the sixth day of early voting, 11.7% of registered Marylanders have participated in early voting. Today’s first graph shows the share in each county who had cast ballots early at the close of yesterday’s early voting. While almost 25% of voters in Talbotians have done their civic duty via early voting, under 5% of Alleganyites have done the same.

The share of registered voters who have returned absentee ballots is much smaller. As the following graph reveals, only 1.4% of Marylanders have returned absentee ballots.

Just 37.6% of absentee ballots mailed have been returned, so that figure will surely rise. Even if every single absentee ballot is returned, that would account for 3.6% of all registered voters – a much lower share than ballots cast via early voting.

Talbot is strong in absentees as well as early voting but Montgomery leads the class with 2.3% of registered voters having returned absentee ballots. Charles is the lowest with just 0.8% of registered voters having done the same.

Three of the four jurisdictions at the low end of people voting by absentee ballot are majority black or close to majority black (Prince George’s, Baltimore City and Charles). Heavily white Harford is the fourth county in this lowest group. There are also no heated executive races in these four counties.

The final graph shows the combination of early voters and absentees to give an overall sense of pre-election turnout. Overall, 13.0% of registered Marylanders have already cast ballots.

Share

Really, It’s Not a Youth Wave. It’s a Senior Tsunami.

Earlier today, I published a piece arguing that there is no blue wave based on the early voting statistics. One reader pointed out on twitter that information about whether there was a wave could be better gauged by comparison with the past. After all, young voters could have closed the gap even if they remain behind older voters.

In order to provide a better basis for examination, I calculated early voting rates at the end of the fifth day of early voting for 2014, 2016 and 2018, which are shown in the above table. I used the same method as described in the post earlier today.

I suppose an optimistic reader might point out that early voting among 18-24 and 25-44 voters is three times higher than the abysmal turnout of 2014, a year when Democrats were unmotivated and demobilized.

That comparison seems a bit facile when you consider that the absolute turnout rates remain low. Three times more of a very small number is a slightly less small number. As of now, it means 8,111 18-24 year olds have voted than in 2014.

Comparisons with 2016 are less favorable. The share of early voters in the two youngest cohorts is only around 60% as large as at the same time during early voting in 2016. That was a presidential year, so we naturally expect turnout to be higher despite the absence of the panoply of state and local offices up at midterm.

At the same time, when Ben Jealous said Democrats needed a more progressive candidate to inspire higher turnout, I don’t think that the former co-chair of Bernie Sanders’s campaign was suggesting that he could do about 60% as well as Hillary Clinton.

Moreover, the older cohorts are much closer to turning out at 2016 rates than the younger cohorts. The 45-64 cohort has so far turned out at 69% of the rate of 2016. Even more impressively, the 65 and older cohort has seen very little drop off. The share of voters among seniors who voted is 91% of 2016 rates.

While the other age cohorts turnout rates appear roughly in the middle of their 2014 and 2016 turnout rates, the rate for seniors is clearly far closer to the much higher 2016 rates. Don’t forget that this group also a had a far higher bar to meet.

Comparing the difference between turnout rates for the oldest and youngest cohorts tells a similar story. In percentage points, older voters participated in early voting 8.6% more in 2014, 17.3% more in 2016, and 17.0% more in 2018.

The changes from 2014 to 2018 are even more dramatic. Yes, the youngest voters increased their turnout from 0.7% to 2.2%. But older voters jumped from 9.3% to 19.2%. That’s a gain of 9.9% as opposed to a gain of 1.4%.

In short, the evidence doesn’t support the conclusion that young Maryland voters are highly “energized” and eager to vote compared to other age cohorts, as claimed by the Jealous campaign. In early voting, it’s not the young but the old who are showing the way.

It’s not a youthful blue wave. It’s a senior tsunami.

Share

Early Voting Day 5 Stats

At the end of yesterday, 9.3% of registered Maryland voters had taken part in early voting. Talbot continues to lead the early voting pack as over one-fifth of its registered voters have now cast ballots. Allegany trails at the end with just 3.6% having participated in early voting. Indeed, all Western Maryland counties lag in early voting.

Most counties with hot executive races – Howard, Baltimore County and Anne Arundel – continue to have above average turnout but Frederick continues to be an exception. Montgomery has very average turnout despite its comparatively unusual three-way contest.

Most counties in CD 1 are also voting at high rates. Dorchester and Cecil continue to lag with Wicomico just below average but closing the gap with the state average compared to yesterday. It’s interesting to see Somerset in the above average category as this relatively poor county often has low turnout.

Share

MoCo Early Vote Day 5

Early voting participation bounced back after the slow weekend to the highest so far this year in Montgomery, as 14,247 hit the polls – just 27 more voters than turned out on the first day.

These numbers, however, don’t reflect changes in the composition of who voted early in Maryland’s largest county, The 72.8% share of Democrats among early voters was up 0.7% over the first day. In contrast, the 13.0% share of Republicans was down 2.0% as the share of independents rose.

At the end of day 5, 11.6% of registered Democrats in Montgomery had voted early, compared to 7.0% of Republicans and 5.9% of Democrats. To the extent that Montgomery has been turning out at slightly above state averages, it’s due to Democrats.

While Republicans may make up the difference on Election Day, the banked votes allows Democrats to focus on a smaller number of people who haven’t voted yet. You begin to see why Republicans don’t like early voting.

Share

No Evidence of Blue Wave Youth Turnout in Maryland Early Voting

At the end of the fourth day of early voting, age appears heavily correlated with participation in early voting. According to the raw data released by the State Board of Elections, here are the number of people who early voted by age cohort:

18-24: 9,588.
25-44: 41,586.
45-64: 117,992.
65 and older: 101,787
unknown: 7,818.

Looking simply at the raw numbers, the old are casting early voting ballots in massively higher numbers than the young. For example, the 45-64 cohort had 284% more voters than the 25-44 cohort. Both cover 20 year periods (i.e. one generation).

What does it look like if you consider the rate of turnout rather than absolute numbers? I used the 2015 Maryland Department of Planning population estimates to gauge the size of each cohort’s population. (It’s not perfect as it includes non-citizens but gives a rough indicator. Age is reported in five-year groups, so I estimated the 18 and 19 year olds as 40% of all people ages 15-19.)

Here are the resulting estimates of early voting turnout rates:

18-24: 1.7%
25-44: 2.7%
45-64: 7.4%
65 and older: 14.4%

If anything, I suspect that this understates age differences. Remember that among Latinos and Asian Americans, two groups with large immigrant populations, kids are far more likely to be citizens than their parents because many were born in the U.S. and are citizens and eligible voters by right. As a result, the older cohorts likely includes higher shares of non-citizens.

Some might ascribe especially low rates among 18-24 year olds due to many people this age being away at college. This may indeed depress turnout figures somewhat but turnout rates among 25-44 year olds are also very low.

The Ben Jealous campaign has argued that the polls showing Hogan leading him handily are wrong because, among other reasons, they “undercount young people” who are “energized” about voting this year. So far, the early voting data suggest that no blue wave of young voters has arrived yet.

Share

What Explains Which Counties Have High Rates of Early Voting?

Earlier today, I presented data on the share of people who have voted early for each Maryland county. At the end of the fourth day of early voting, 7.1% of registered Marylanders had voted. The share across counties varies much more widely from 2.8% in Allegany to 15.5% in Talbot.

What explains the variation?

St. Mary’s Political Science Professor Todd Eberly suggested on Twitter that he thought there were signs of higher turnout in counties that (1) have competitive executive races, and (2) are in the First Congressional District. Is he right?

Two other hypotheses occurred to me: (3) turnout might be higher in counties with more older residents as age is associated with participation, and (4) race might also be associated with voting. In particular, Latinos and Asian Americans tend to vote at lower rates than whites or African Americans.

I created multivariate models of turnout at the end of the fourth day of early voting in order to test these hypotheses. The models allow one to assess the probable impact of one factor while controlling for others. However, the relatively small number of units in Maryland (24) precludes including too many variables.

So where are more people voting? Increasing the share of the population over age 50 by 2% raises the predicted share of early voters in a county by an estimated 0.59% (p = .02 for the statistically minded who are familiar with OLS models).

Counties in the First CD also seem to be participating at higher rates, though the effect is small. In counties in which 100% of registered voters live in CD 1, turnout is an estimated 0.02% higher than elsewhere in the state (p = .04). Though perceived as a safe Republican seat, voters there seem energized this year.

Counties with hot executive races (defined here as Anne Arundel, Baltimore County, Frederick and Howard) are seeing much higher early voting turnout. The estimated impact of close exec contest on the share of early voters at the end of day 4 is 2.75% (p = .04). Including Montgomery as a hot race causes the effect to vanish, suggesting that our unusual three-way race is not motivating EV turnout in the same way in MoCo.

Contrary to my expectation due to historically lower rates of Latino and Asian turnout, counties with more non-Hispanic whites seem to have fewer early voters. Increasing their share of the population by 2% is estimated to reduce EV turnout at the end of day 4 by 0.10%. However, the effect is marginal as statistical significance is normally assessed (p = .09) and I would interpret with especial caution.

Closer examination of the data reveals that any impact is driven by the presence of Latinos and that changes in the share of blacks have no real impact on EV turnout. Only Montgomery and Prince George’s have relatively high shares of Latinos (and MoCo also has the highest share of Asians), so I suspect that what is being captured by the model is that these two counties have relatively high turnout once you consider that they are not in CD 1, don’t have tight exec races, and the age of their populations.

In case you were counting, Todd Eberly wins the hypothesis prediction race. Both of his panned out while one of my two turned out to be a turkey-and Thanksgiving isn’t quite here yet.


Share

Early Voting Turnout around the State

The share of all active registered voters who have participated in early voting varies widely around the state from a low of 2.8% in Allegany to 15.5% in Talbot. In Maryland as a whole, 7.1% have cast ballots via early voting.

The state’s largest jurisdictions show quite a spread too. Baltimore City has had low early voting turnout at 4.8%, as has Charles at 5.9%. Prince George’s and Frederick are slightly below average at 6.2%. In contrast, Montgomery is just a bit above average at 7.3%.

The Baltimore suburbs are generally showing above average turnout. Baltimore County and Anne Arundel are a slightly above average at 7.8% and 7.9%, respectively. EV turnout is 9.2% in Harford, and 10.1% in Howard.

While Democrats are turning out at much higher rates than other voters in Montgomery, the share of Democrats does not appear related to overall voter turnout across counties. Indeed, two jurisdictions with lower early voting turnout have the highest rates of Democratic registration-Baltimore City and Prince George’s.

These are also the only two black-majority jurisdictions. Charles is on the edge and also turning out at below state average rates in early voting. (Montgomery is a majority-minority county but with a mixture of non-white groups composing the majority.)

Ben Jealous has repeatedly touted his ability to get minority voters out and his campaign claims that polls are not capturing high rates of minority voting. So far, however, early voting turnout in the state’s most heavily African-American jurisdictions is under performing the state as a whole.

Note that turnout might still be up relative to the past but this graph doesn’t provide evidence in support of world-beating early voting in heavily black jurisdictions (unless we also think that white turnout in these same areas is extremely low for some reason).

Share

Maryland Politics Watch