The following is a guest post by Adam Pagnucco:
Unlike most state and local races below the level of Governor, the contest in Congressional District 8 has seen a lot of television ads. These ads are trackable, although not easily. Today we present a first cut on who is advertising where, and for how much.
The Federal Communications Commission (FCC) requires TV and radio stations to report on political ad purchases. In 2012, the FCC required broadcast TV stations to post political ad purchases on the agency’s website, but with a large caveat: the files are in pdf format. They are not accessible through spreadsheet or database software, and are therefore not readily crunchable. They are also not searchable. A researcher has to go through every relevant station, one at a time, review all pertinent folders and manually enter the data to prep it for analysis. This is a challenging and time consuming task!
The data is also incomplete. Cable and satellite TV stations and radio stations are not currently required to report their political ads to the website, although they will be starting in the next cycle. Furthermore, the reports do not include production costs. They only include amounts paid to the TV stations, both gross and net of commissions. So the information reflects only a portion of candidate spending on TV. That said, broadcast TV is an important part of large-scale federal elections and data on it is worth looking at.
We assembled political ad data for all CD8 candidates in the year 2016 for all of the Washington area’s broadcast TV stations. Contracts often cover a week or more into the future, so the most recent ones we obtained are active through April 16 – ten days before primary election day. The broadcasters reported a combined total of 127 contracts through noon, April 4. Here is the number of spots and gross amount for each broadcaster reporting.
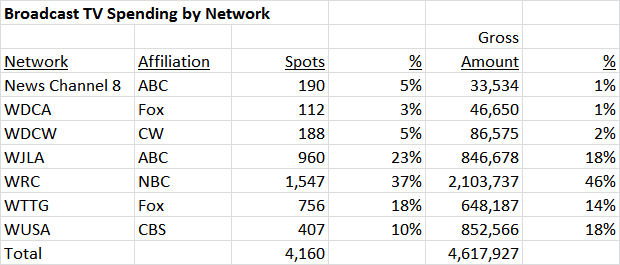
Unsurprisingly, the big four networks dominate. Also not surprising is that WRC-TV, long the top-rated local network, is a runaway leader in ad spending.
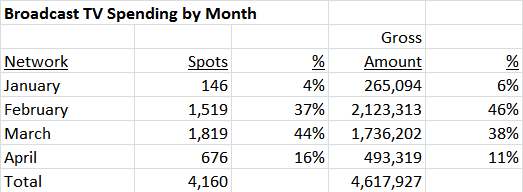
David Trone kicked off the 2016 ad season on January 26, when he began advertising on every network in our dataset. On February 7, he paid for five spots worth $200,000 on WUSA on Super Bowl Sunday. (That amount is more than what most candidates for State Senator and Delegate spend in their entire campaigns.) Kathleen Matthews began advertising on February 8. Jamie Raskin joined in on March 24 and Kumar Barve followed on April 6. The drop in total spending between February and March was caused by a decline in Trone’s spending, part of which is due to the fact that there was no Super Bowl in March. April spending is down because the contracts have not all been reported yet.
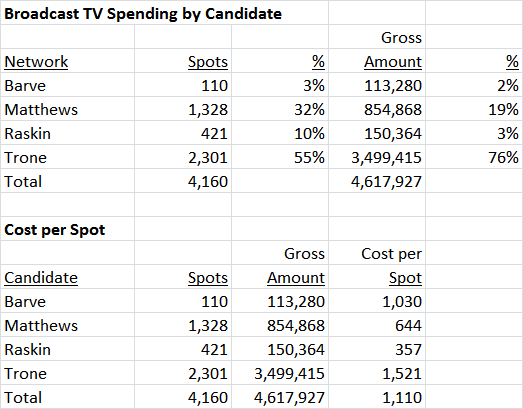
Trone dominates this category of spending, accounting for the majority of spots and roughly three quarters of gross amounts paid to broadcasters. There are big differences in the costs paid by the candidates, and that reflects their strategies. All four candidates advertise during news programs and those shows tend to charge the highest rates. Matthews mixes in cheaper daytime television like The Meredith Viera Show, Days of Our Lives, Who Wants to be a Millionaire, CBS Soaps and The Insider. Raskin is keeping his costs down by running 15-second spots, half the length of his competitors.
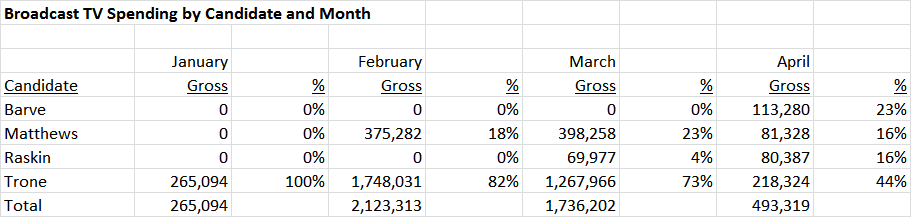
Trone’s edge in TV has been eroding over time. He had January all to himself. But his CD8 TV market share dropped to 82% in February, 73% in March and 44% in April (so far) as other candidates have gone live. (That April number could change a lot!) Late TV commercials may mean more than early ones because many voters, especially casual ones, make up their minds late.
A few other things are worth mentioning.
- Trone’s real dominance may not be on TV or in mail, but in his digital advertising program. His ads are everywhere on the Washington Post and Bethesda Magazine websites. There is no known source of reporting on those ads outside of the candidates’ campaign finance reports, and even they may be a bit murky. In any case, Trone is making a big bet on digital and his opponents are not.
- Matthews reported an end-of-year cash balance of $1.1 million, but this data shows that she has spent over $800,000 on broadcast TV alone. Matthews has a formidable campaign operation, with staff, field, mail, office expenses and more. This suggests that she has had a strong fundraising quarter, or is self-financing, or perhaps both.
- Raskin is emphasizing mail over TV. He has the second-most extensive mail program in the race behind Trone. This is a deliberate calculation. Mail is much easier to target than broadcast TV. Mail can be sent to regular Democratic primary voters – the people who tend to pay closer attention to elections than others – while TV ads are sprayed into the ether to be viewed by regular voters, casual voters, non-voters, members of other parties and residents outside the district. Raskin believes that regular voters will support him if they know that he is a) very liberal, b) very experienced in passing liberal bills and c) has a better chance to win than the other liberal elected officials running against him. (That message has offended Barve, who has been in office for sixteen years more than Raskin and is a high-ranking member of House leadership.) All three publicly disclosed polls in the race show Raskin at close to 30% of the vote. If he can hold on to his supporters and his mail strategy gets him another five points, could that be enough to win?
How much does TV spending matter? John Delaney won his seat in Congress in part through TV ads, and David Trone has so far spent at least double his total. Kathleen Matthews trails, but she has spent enough to be heard. The other candidates have not made a major commitment to TV. Will they pay a price for that?
We will have an update on this data shortly before the primary.