Category Archives: redistricting

Competition and Responsiveness in Redistricting

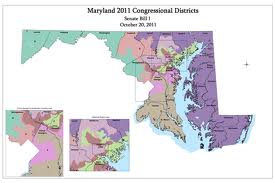
In previous posts, I’ve contended that Maryland’s extremely non-compact districts are nonetheless less skewed to the Democrats than many think. Moreover, compactness and non-partisan maps don’t necessarily result in fair outcomes.

Today, I look at the role of redistricting in promoting competition and responsiveness. The argument in favor rests on the idea that competition is the lifeblood of democracy. It helps voters keep politicians accountable. When voters swing away from one party and to another, the results should reflect the change.

It may seem odd to take into account whether a plan creates competitive districts. However, the Arizona Independent Redistricting Commission operates under a mandate to prioritize them. It would also potentially result in greater shifts in House seats with changes in the vote for the U.S. House.

Not all agree that competition and responsiveness are a good thing. Tom Brunell has provocatively argued that mapmakers should create as many ultra-safe districts as possible. He points out that fewer voters cast ballots for the losing candidate–and therefore are happier with the outcome–in safe districts.

Let’s work with the other side of the argument, as I suspect more prefer responsiveness to changes in voting behavior rather than static outcomes no matter the election results. How well does Maryland’s current plan promote competition (i.e. close elections) or responsiveness (i.e. changes in seats won with changes in voting behavior)?

Not well. In 2012. the closest race was in the Sixth where challenge John Delaney ousted incumbent Rep. Roscoe Bartlett by 21 points. The next closest race was in the Eighth where Rep. Chris Van Hollen won reelection from his redrawn district by over 30 points.

If Republicans have a problem with the map, it should not be that it is inherently unfair. After all, if Maryland Republican candidates could win one-half of the votes, they likely carry one-half of the seats. Nevertheless, the plan doesn’t look likely to respond to less major changes in the electorate.

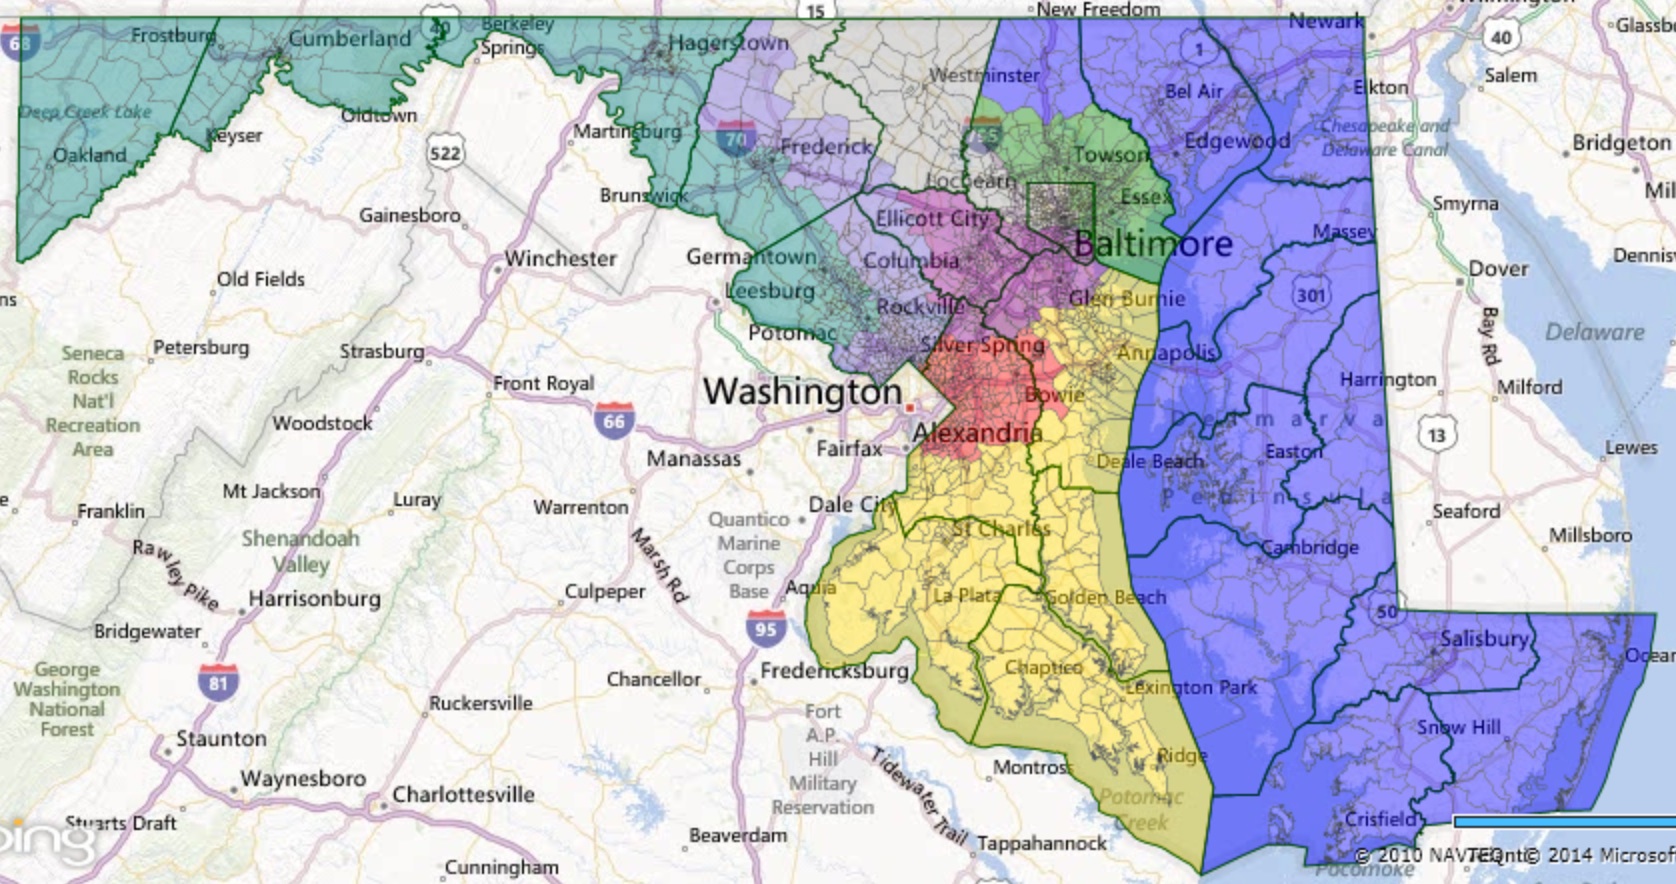
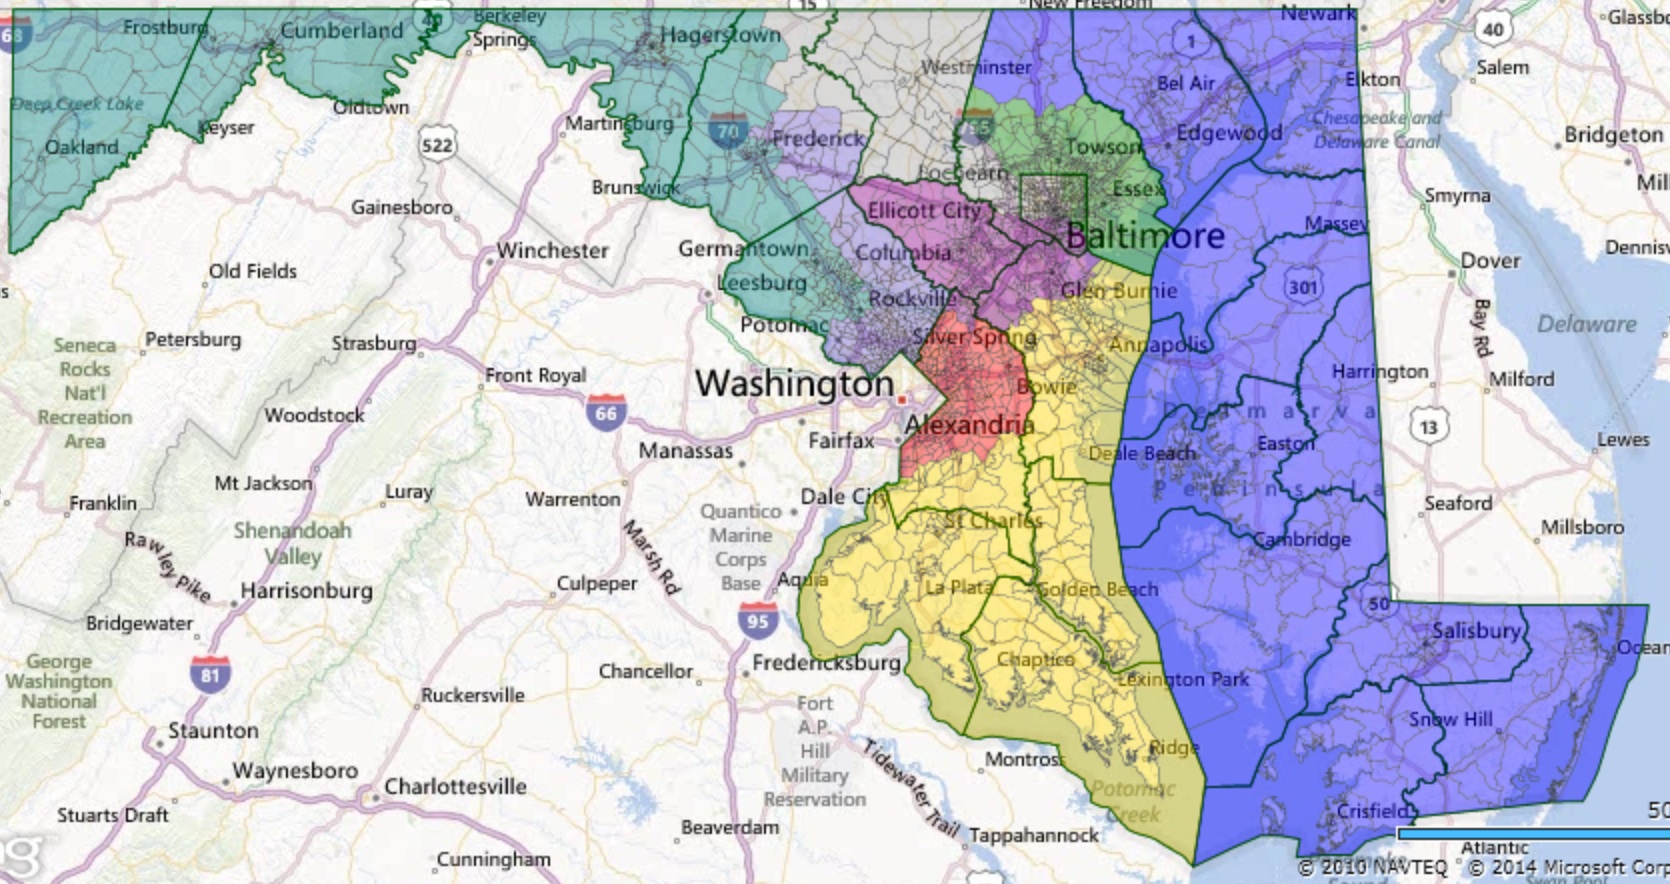
Below is a rough draft of a plan that reflects the Democratic edge but is likely to be more responsive to changes in electoral outcomes:

LublinPlan1
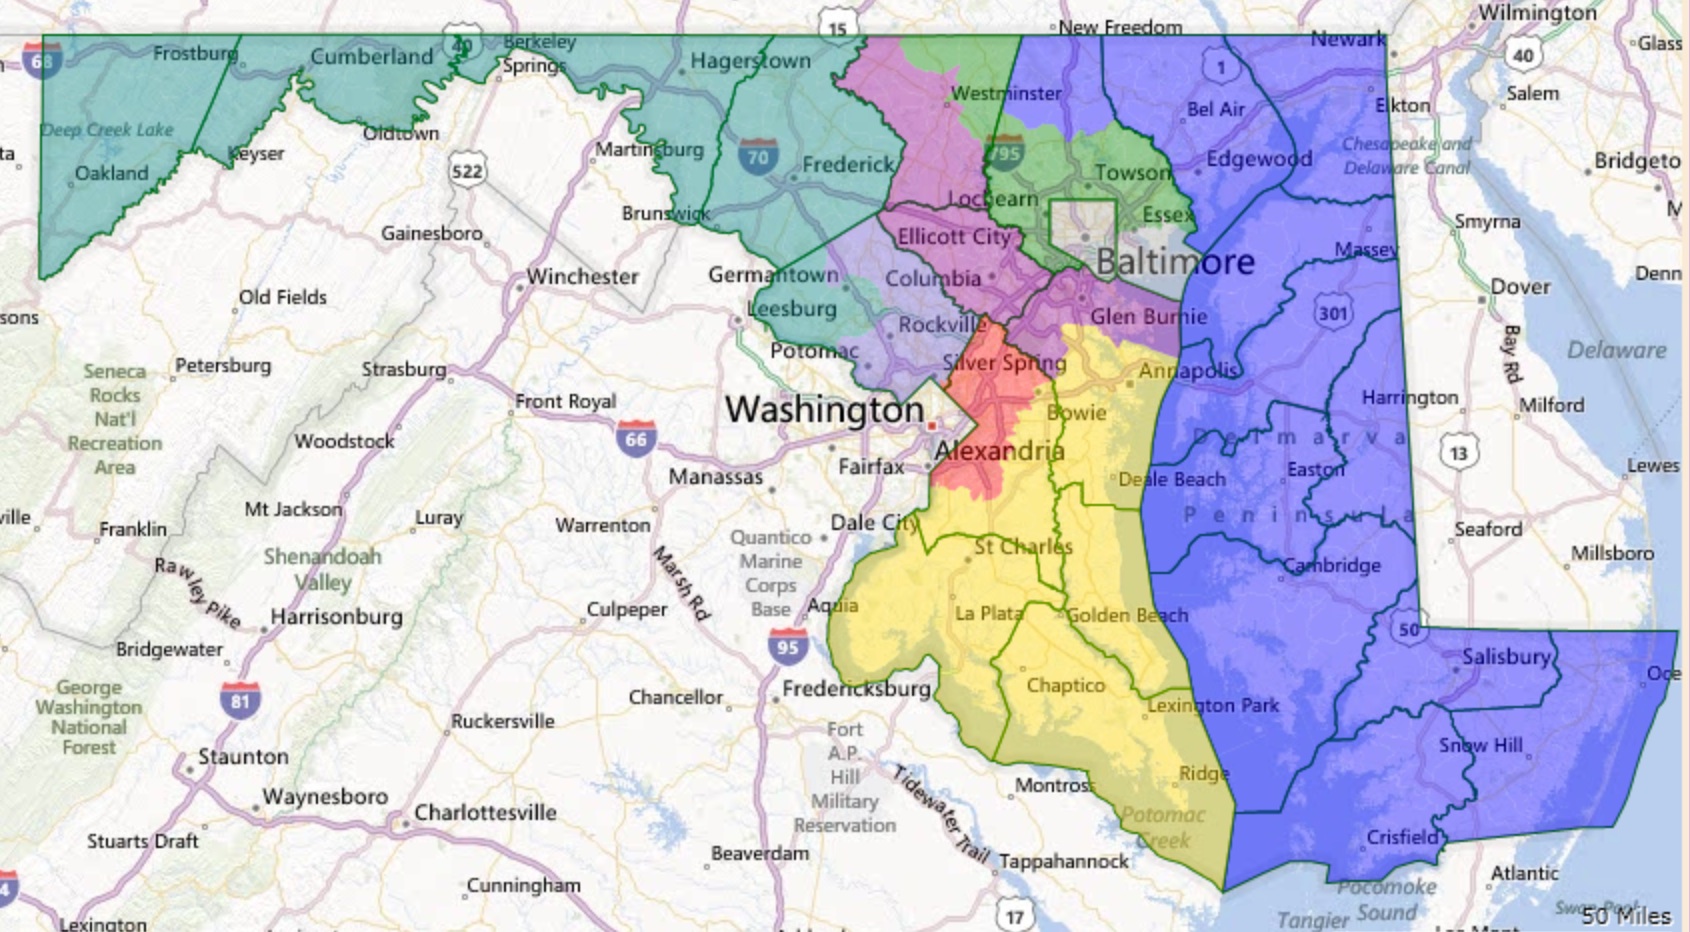
More Competitive Congressional Redistricting Plan

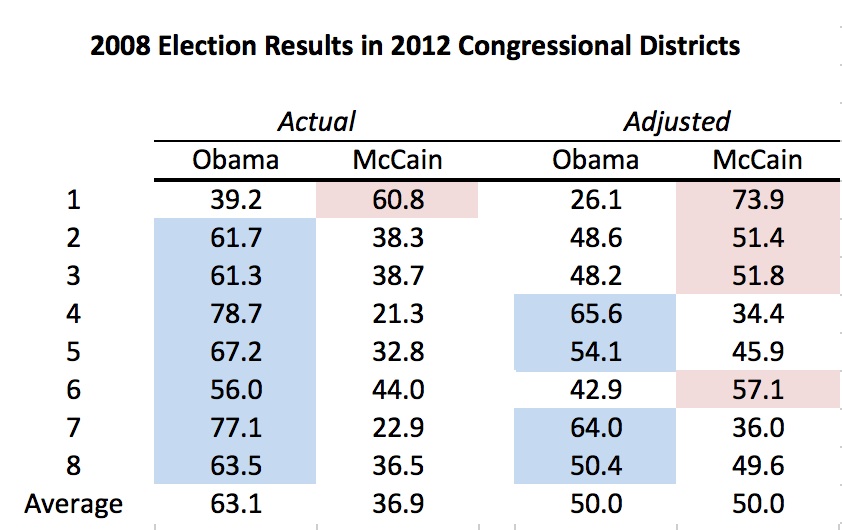
President Obama won a majority in 2008 in seven of the eight districts. However, his victory level was not nearly as high in several of the districts as under the current plan:

MDComp
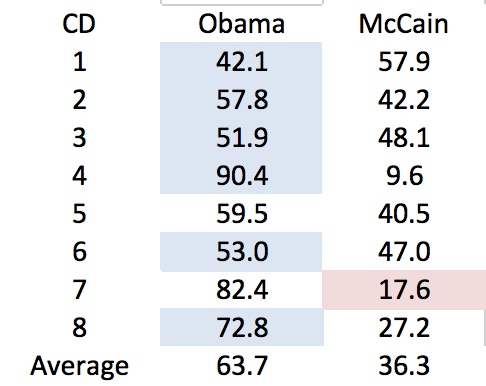
In this plan, the Republicans would need a shift of only 1.9% to gain the Third District and 3.0% to gain the Sixth District. One can imagine regular heated competition for both districts with them changing hands depending on the vicissitudes of the electorate.

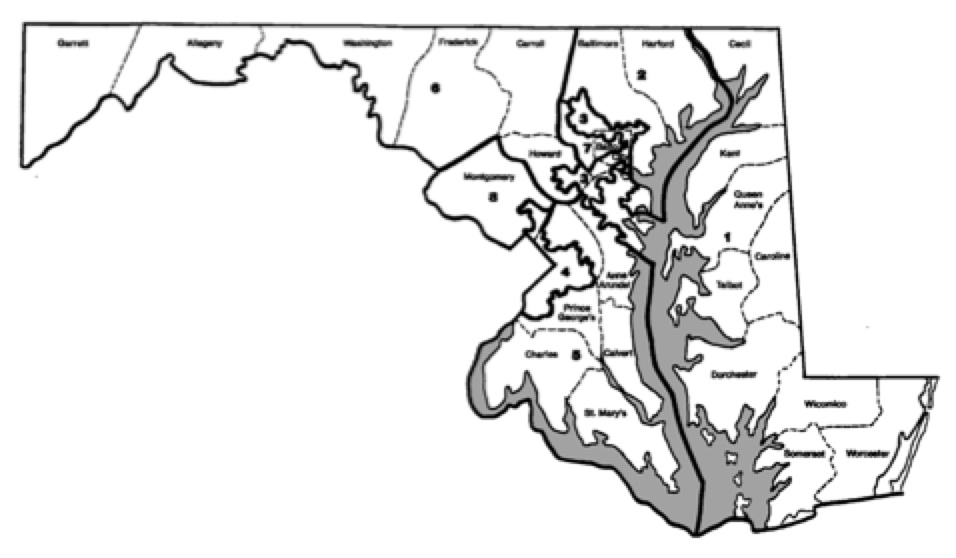
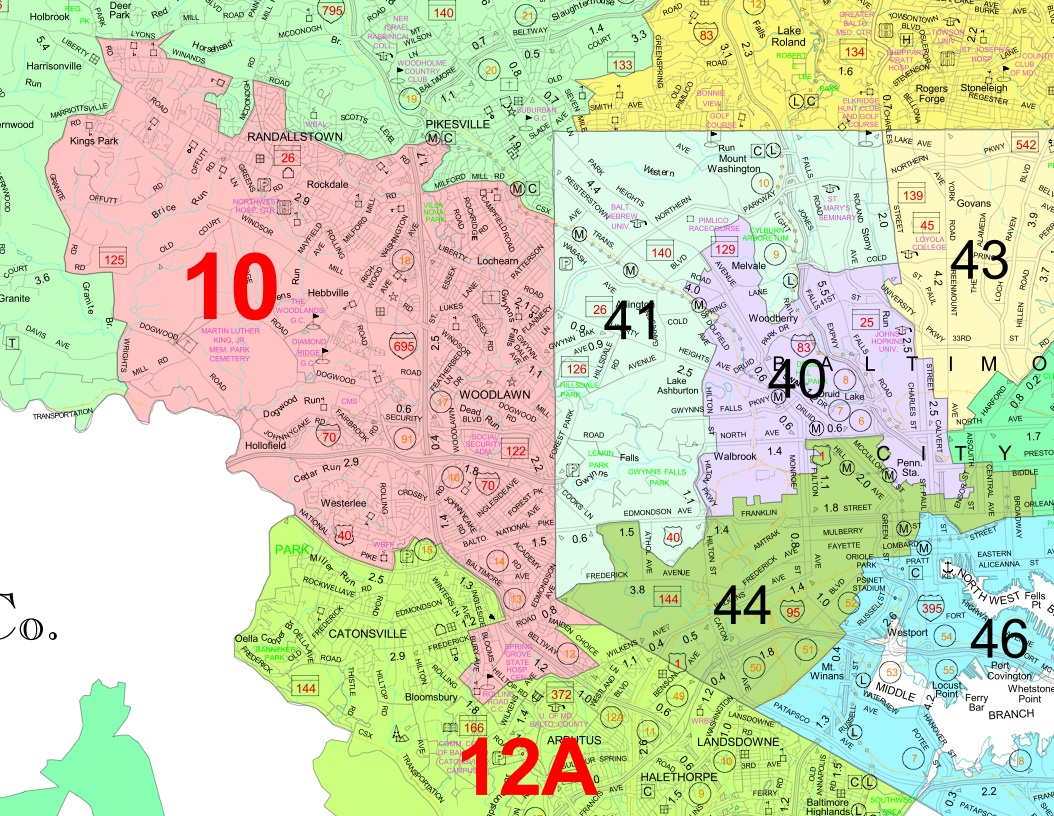
This plan would also be far more compact and violate fewer county boundaries than the current plan. The 1st would contain the entire Eastern Shore along with Harford and a bit of northern Baltimore County. It does not cross the Bay Bridge. The Seventh, a 54% black voting-age population district, would include all of Baltimore City along with a chunk of neighboring Baltimore County.

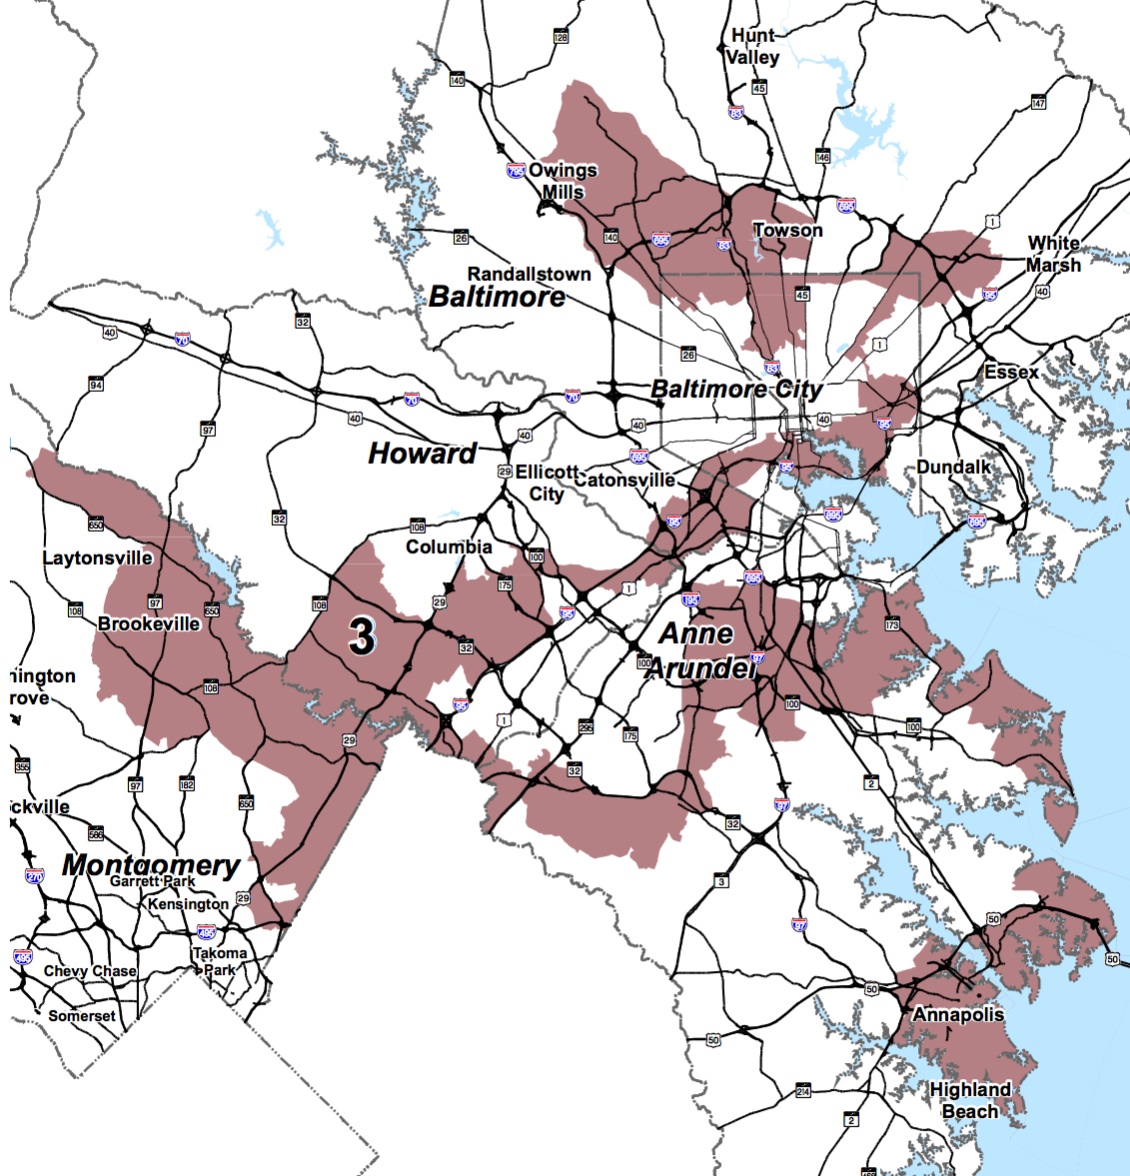
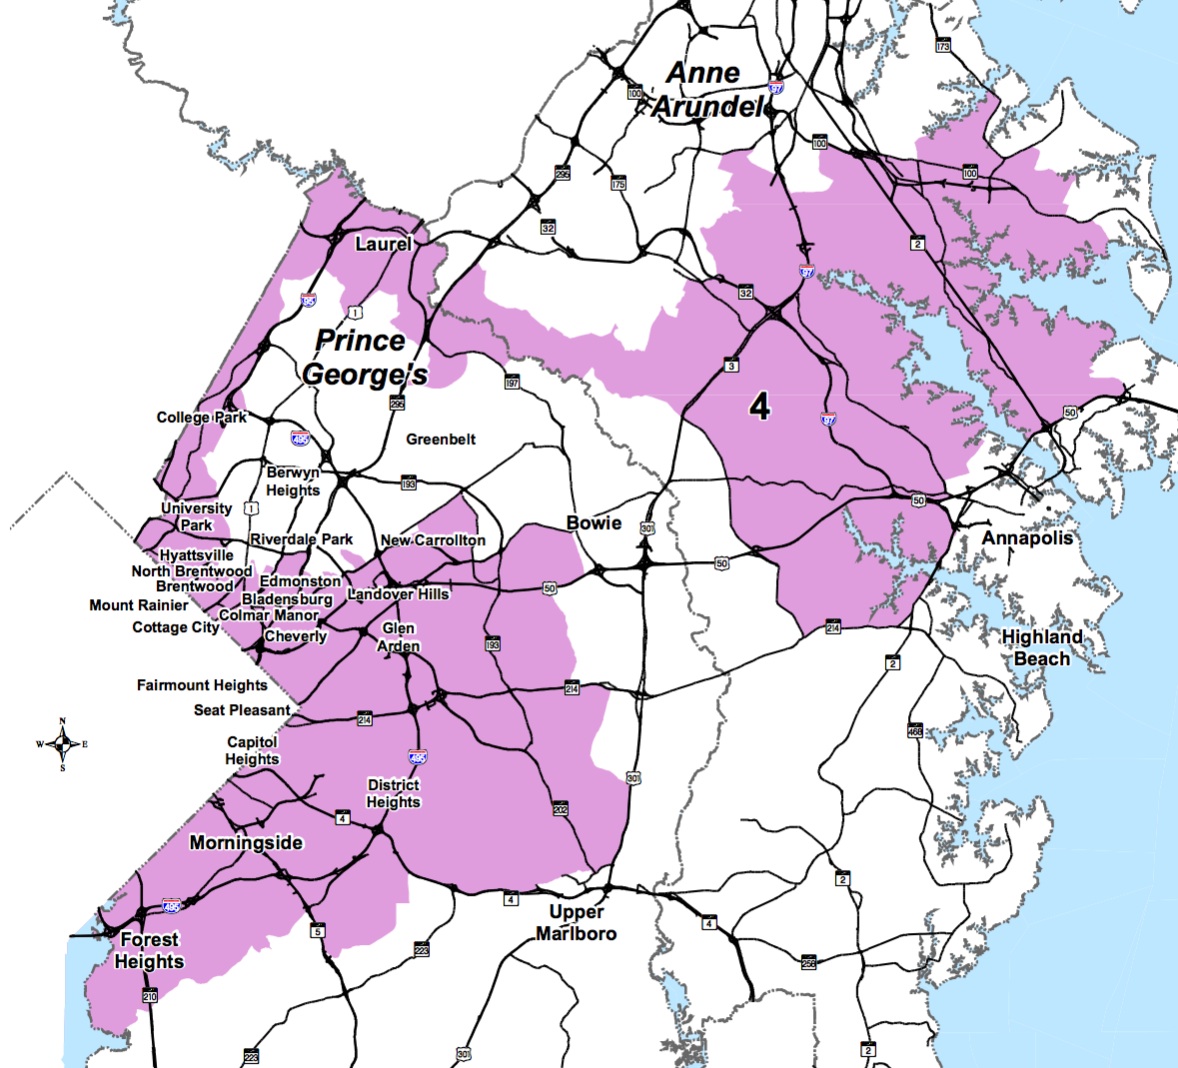
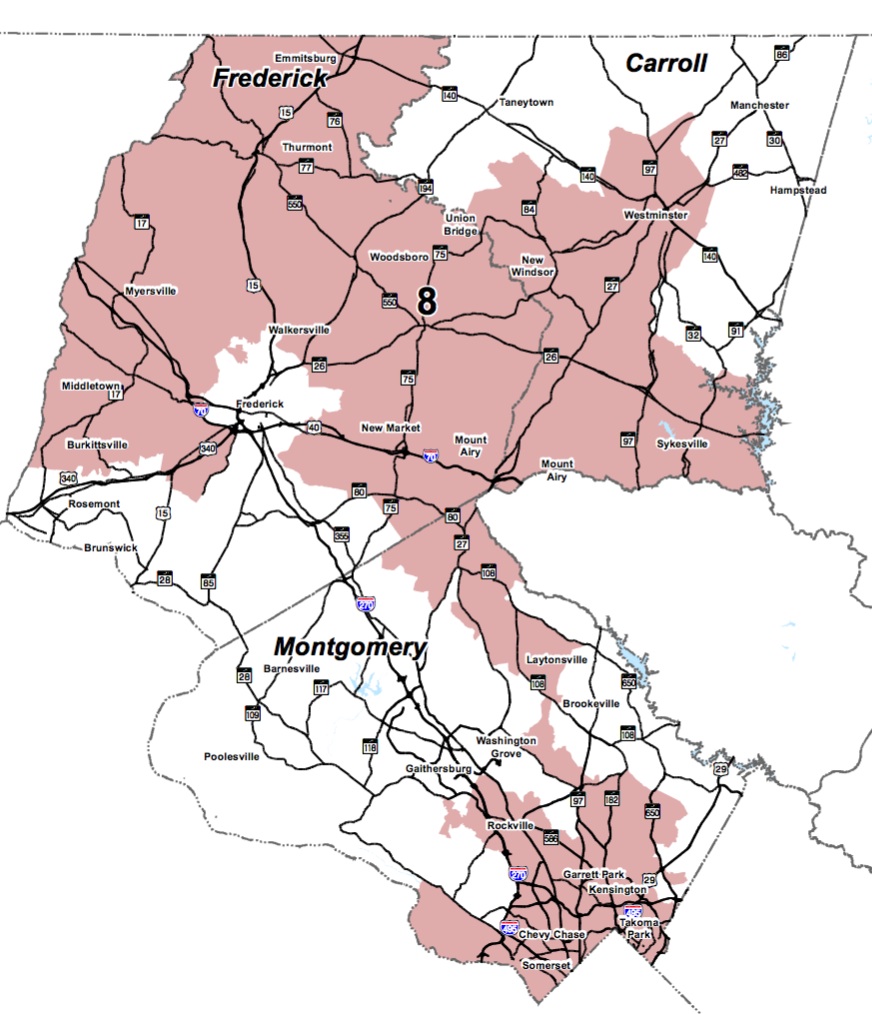
The new 2nd would take in the remainder of Baltimore County along with a bit of neighboring Carroll. The 8th is entirely in Montgomery County. The 6th includes all of western Maryland along with almost all of the rest of Montgomery. The 4th, a 61% black VAP district, is almost entirely in northern Prince George’s.

Finally, the 5th is composed of southern Maryland, the rest of Prince George’s and southern Anne Arundel. The 3rd becomes a central Maryland district with all of Howard, northern Anne Arundel and most of Carrol Counties.

The major problem with this plan is that is most likely too favorable to the Republicans. A gain of 7.8% of the vote would allow the GOP to win one-half of the districts even though they would fall far short of the vote share required for an even statewide split.

They might even win all four with an even smaller percentage as the new versions of the 2nd, 3rd, and 6th contain above average shares of white voters. This matters because whites are more likely to shift way from the Democrats when a pro-Republican wind blows than black voters, who are highly concentrated in the 4th and 7th.

So greater competition and responsiveness not always conducive to partisan fairness. However, one might be able to construct a plan that better meets both requirements, though that could result in less compact districts.


Share

Rorschach Map of Incumbent Desires

Much has been made of the, ahem, “creative” boundaries of Maryland’s current congressional districts. A previous post provided more detailed maps that show the true artistry of the districts. But here is a statewide view that probably doesn’t do it full justice:

CDMDMaryland’s Current Congressional District Map

Many cite the non-compact boundaries as evidence of partisanship. Certainly, the 6th District was reconfigured to aid Democrats, who picked up the seat in 2012. However, Democrats did not have to draw these non-compact districts to gain a 7-1 majority in place of the previous 6-2 split. The following plan has seven districts that Obama won by 15% or more in 2008:

Obama15ptsAlternative Congressional Plan 1

While probably not the most compact plan that could be drawn, it also is clearly much more compact than the enacted plan. Beyond containing seven very Democratic districts, it also still contains two districts that are over 50% black in voting-age population.

A map that gave Democrats at least a 10% advantage in seven districts, again as measured by support for Obama in 2008, could be made even more compact and violate fewer county boundaries:

Obama10ptsAlternative Congressional District Plan 2

In this version, District 8 doesn’t reach the Pennsylvania border or take in any portion of Carroll County, which is no longer split. The Fourth District is also entirely within Prince George’s. Montgomery County has only two districts instead of three.

So why did the Democrats choose to adopt a plan with such meandering districts instead of a simpler version? According to many different sources, the answer lies in the desire to favor the preferences of certain incumbents, even when they were highly idiosyncratic and would not alter their reelection chances.

(1) Rep. Steny Hoyer insisted on continuing to represent UMD College Park, which he has represented since entering Congress. (Love the Turtle!) However, College Park is at the northwestern end of Prince George’s. Accommodating the desires of this powerful representative forced many other changes to plan.

For example, the 4th couldn’t continue to go into Montgomery if the 6th was to take in significant portions of that County, so the 4th now crawls around the edge of Prince George’s to enable it to scoop up Republican voters in Anne Arundel.

(2) Similarly, Rep. Dutch Ruppersberger sits on the intelligence committee and wanted to represent both Fort Meade and the Aberdeen Proving Ground. (Couldn’t we just buy him his own spy cam?) Even more creativity ensued as these two facilities lies at the opposite ends of the Baltimore region

(3) Rep. Elijah Cummings did not want to represent Carroll County, throwing yet another complication into the mix. Carroll is very Republican but would have easily been swamped by Cummings’ Baltimore base. So now Rep. Chris Van Hollen represents parts of Carroll County.

(4) Rep. John Sarbanes felt strongly that he wanted to continue to represent Annapolis, adding another layer of complexity into the plan’s requirements. Drafting a plan to satisfied this demand along with Ruppersberger’s helps explain how the 2nd and 3rd districts took on even more convoluted shapes.

(5) Complicating it all further was that so several representatives–Cummings, Harris, Ruppersberger, and Sarbanes–live with a small area near Baltimore. While living in the district is not required–just ask John Delaney–most prefer to do it.

And that’s how we ended up with this:

CD3

By the way, there is no legal impediment to gerrymandering for incumbents. Indeed, courts have cited it as a legitimate rationale for states to craft plans in a particular manner.

Share

All the Pretty Districts

In two posts yesterday, I argued that Maryland’s congressional redistricting plan is less outrageously biased to the Democrats than assumed by many despite its extremely non-compact lines. This post focuses on why pretty, compact lines may not produce plans that treat both parties fairly.

First, one can still gerrymander without necessarily producing especially non-compact shapes. In the 1980s, Arizona GOP adopted a plan that did not look particularly bad but still worked greatly to their benefit by packing Democrats into a single district.

The one Democratic district had a reasonably regular triangular shape. But it stretched across hundreds of miles of empty desert with its vertices being Yuma along with the especially Democratic sections of Phoenix and Tucson.

MD1990sCDsMaryland Congressional Plan 1992-2000

The Maryland plan used from 1992 through 2000 may not have been as compact as possible but was much more so than the current plan. Though drafted by Democrats, it didn’t work very well for them in the 2000 elections.

MD2000CDelection2000 Maryland Congressional Results

The Democrats won by more than 200,000 votes, or 11%, but still only won 50% of the eight seats. Usually, though by no means always, a clear win in votes will give the majority party more than its fair share of seats.

As this example demonstrates, the outcome in single-member district electoral systems depends heavily upon how the votes are distributed. Parties lose out when they supporters are not efficiently spread across the state.

Parties whose voters are too packed–that is, over concentrated–into a few districts will win those districts by wide margins but forgo opportunities to gain neighboring districts. On the other hand, parties with supporters spread too thinly risk winning no seats even if they receive many votes. In winner-take-all elections, there is no prize for second place.

The distribution of voters often has a major impact on election outcomes even if constituency boundaries are drawn by excellent nonpartisan procedures. The United Kingdom has nonpartisan boundary commissions draw their maps. Yet they hardly treat the two largest parties equally.

Between 1979 and 1992, the Conservatives won four straight elections with between 42% and 44% of the vote. Their majorities varying greatly in size, ranging from 52% to 61% of parliamentary seats. They performed at their best in 1983 when the second and third place parties nearly tied, leaving the Conservatives ahead in more seats than other years.

Labour won 41% to 43% of the vote in 1997 and 2001 but gained more substantial majorities–62% to 63% of all seats–than the Conservatives did with about the same vote share. In 2005, Labour even gained a majority of 55% of seats with just 35% of the vote, the lowest share in British history. However, the Conservatives gained only a minority in 2010 with 36% of the vote.

The key lesson is that maps with compact districts and regular lines do not necessarily produce unbiased outcomes that reward parties with an equal number of seats for the same share of votes. The distribution of voters is critical.

Next up: competitiveness, responsiveness and redistricting.

Share

Compactness in Redistricting

When people refer to geographical compactness, they refer to districts of sensible shape. Why does this matter? First, odd shapes can indicate gerrymandering. Second, the idea of single-member districts is grounded in the representation of territorially organized communities where each area has its representative, though many dispute this idea of community.

One common compactness measure, usually referenced as the Reock or Dispersion measure, is the ratio of the area of a district to the area of the smallest circle that can enclose the district:

Reock

Reock or Dispersion Measure of Compactness

The idea behind the measure is that a circle is the most compact shape, so it compares the district to the smallest circle that can encompass it. As the name indicates, it is viewed as a good measure of the dispersion of the area of a district.

Another widely used compactness measure is the ratio of the area of a district to the area of a circle with the same perimeter as the district (the Polsby-Popper or Perimeter measure):

Polsby-Popper

Polsby-Popper or Perimeter Measure

This measure tends to give low (i.e. worse) scores to districts with many crinkles in their boundaries and that are elongated in ways that stretch their boundaries but encompass little territory. In contrast, districts with smooth boundaries that maximize the area enclosed score well.

Complaints about both measures include that one cannot draw only circular districts and that state boundaries are not circular. For this reason, it is important to compare district scores to other districts and especially other plans for districts in the same state.

A final compactness measure is the Grofman Interocular Test. Developed by my humorous friend and sometime coauthor, Bernie Grofman, it’s his way of asking does “evidence of gerrymandering leap up and hit you in the eyeballs.” Rather like Justice Stewart said about pornography, gerrymandeirng can be hard to define but you know it when you see it.

Closely related to compactness are the ideas of contiguity and adherence to administrative boundaries. Contiguity is simply that one could, at least in theory, travel from any point in a district to any other point without leaving the district. A stricter version might require that one can travel in practice without having to cross into another district.

Federal law now requires that congressional districts be contiguous in the looser sense. In recent times, some districts have stretched the principle thinly with point contiguity, which is when districts remain connected at just one point.

Others value adherence to administrative boundaries, such as county and municipal lines, as helping preserve natural communities of interest. Of course, like districts, the boundaries of these units are drawn by people and not truly natural.

Maryland’s districts unquestionably fail any test for compactness. I’m including maps here of four of the eight districts to do the artistry of the plan full justice:

CD2Maryland’s Second Congressional District

CD3Maryland’s Third Congressional District

CD4Maryland’s Fourth Congressional District

CD8Maryland’s Eighth Congressional District

Maryland’s eight districts had the lowest average compactness score of any in the nation, according to both the Dispersion and Perimeter measures.

All four of the above districts are contiguous but very thinly at some points. The 8th has a small link south of Laytonsville to connect the very Democratic southern Montgomery with heavily Republican areas in Frederick and Carroll in a manner that benefits Democrats.

In order to let Rep. Steny Hoyer in the 5th keep areas he desired in northwest Prince George’s around College Park, the 4th skirts narrowly around the edges of Prince George’s and Anne Arundel. This corridor connects heavily black and Democratic areas in Prince George’s to very Republican parts of Anne Arundel. The overall district is a black-majority Democratic seat.

Some have claimed that the 3rd in the least compact district in the country. It certainly gives others a run for their money, as it snakes around the State to take in parts of four counties and Baltimore City. Narrow corridors connect three discrete sections of Baltimore City and County.

The district then meanders west to take in a contiguous chunk of south Howard and northeast Montgomery before arcing through Anne Arundel. It has to jump across water to maintain contiguity with Annapolis and at other points. Apparently, Rep. Sarbanes wanted to keep representing that city.

I think the 2nd may be my personal favorite. Narrow corridors allow it to take in separate portions of Baltimore County before crawling up the coast to take in the most Democratic portions of Howard. It then wanders into Baltimore City and cuts across the harbor on its way to Anne Arundel.

It’s easy to ascribe the non-compact shapes to partisanship. However, the shapes stem even more from the desire to satisfy certain Democratic incumbents–primarily Cummings, Hoyer, Ruppersberger, and Sarbanes–from the look of the map.

Several of these incumbents live close to each other in the Baltimore area  even as population and political power has shifted away to other portions of the State. Baltimore City is now too small for even one congressional district. Yet it still has three.

In the next post, I examine why, just like among people, pretty isn’t always fair in redistricting.


Share

Congressional Plan Fairer Than You Think

CDMD2012 Congressional District Map

Redistricting remains one of the more contentious if arcane subjects in American politics. Unlike in many other western democracies with single-member district elections, such as Australia, Canada and the United Kingdom, the U.S. still usually allows politicians to draw both congressional and state legislative districts.

Some advocate that states ought to construct plans that are fair to Democrats and Republicans. And Maryland’s congressional plan has been attacked as unfair to Republicans not only by the GOP but by other observers, such as St. Mary’s College Professor Todd Eberly.

But how do you measure partisan fairness? Here are two basic principles that some see as underlining a fair plan that does not favor one party over the other along with an assessment of how well Maryland’s current plan lives up to them:

(1) No Partisan Bias. This principle is the simple idea that a party should win 50% of the seats if it wins 50% of the votes. Note that this is not the same as proportionality–that a party wins the same share of seats as votes.

There are different ways of testing for partisan bias. Examining the vote of statewide candidates in different districts is one simple way to test plans (not necessarily the best but easy to comprehend). The advantage of statewide candidates is that one can assess party performance with the same two candidates across all districts.

In this example, I use the presidential race. As is well known, Obama carried seven of the eight current districts in 2008. The two-party vote in each congressional district is shown in the first two columns:

BiasMD

Obama’s average vote share was 63.1%. But what if there was a uniform swing across all district of 13.1% towards McCain? Under this scenario, Obama and McCain would each have averaged 50.0% of the vote (see columns 3 and 4). Interestingly, each would also have carried four districts–exactly 50% of the total.

So the current plan passes a simple and cursory bias test. When each party receives 50% of the vote, each should win 4 districts.

(2) Symmetry reflects that if one party gains 65% of the seats with 55% of the votes, so should the other party. In single-member plurality elections, a party often gains a seat bonus when it wins more than a majority. This principle encapsulates the idea that such a bonus should be symmetrical and equal for both parties.

How symmetrical in Maryland’s plan? Again, examining the presidential vote is illuminating. In the example, below I envision a uniform swing across districts to estimate how many districts McCain would have won if he had received 63.1%–the share Obama actually won in the election.

SymmetryMD

The table suggests that McCain would have carried six districts–one less than Obama carried with the same share of the vote. So the plan is not perfectly symmetrical. The two black-majority districts (4 and 7) contain so many Democratic voters that even a Republican tsunami would not turn them blue, though the 7th comes close.

Examining the data in the table closely further suggests that Republicans would need only an additional 2.5% of the vote to carry all eight districts. However, Democrats would not achieve the same feat if they received the same vote share.

In truth, it can be very hard to construct plans free of bias and perfectly symmetrical. Moreover, swings are rarely uniform and the geographical concentration of partisans can shift over time. Of course, that also doesn’t mean we can’t often do better.

This at-first-glance examination also indicates that moaning about the partisan unfairness of the plan is not necessarily justified even though the plan was crafted by Democrats and one assumes designed to achieve their ends.

Complaints about the plan probably need to focus more on other issues. Next, I examine compactness–one of the major criticisms of Maryland’s redistricting plan.

Share

Charm City Senate Primaries–Challenger Favored in D44

D44New2014 Baltimore City and County District 44

Links to Part I, Part II, Part III, and Part IV of this series on top Senate primaries.

District 43 (D): Incumbent Sen. Joan Carter Conway faces Baltimore City Councilman Bill Henry, whose city council district overlaps with this legislative district. Although the likeable, smart Henry is a strong challenger, key factors render Conway the favorite, as I detailed previously in my overview of this district. Despite some bad press, Conway has far more money and has formed a tight slate with strong delegate incumbents. Rating: Likely Conway.

District 44 (D): As usual, Baltimore City state legislative redistricting was a game of political musical chairs. The City had to lose representation and two-thirds of District 44 has shifted out of the City into the County (see map above). County District 44B will elect two delegates to one from City District 44A.

Virtually all of the new territory was formerly part of District 10 (see map below). In truth, the new District 44 is more the heir to District 10 than to District 44. The new District 10 has taken in much new territory further north in Baltimore County. No wonder Sen. Delores Kelley (D 10) joined Sen. Jim Brochin in filing an unsuccessful lawsuit against the new plan.

Redistricting has set up one of this year’s toughest Senate primaries. Del. Shirley Nathan-Pulliam (D 10), who lives in the portion of the old District 10 that is now part of the new District 44, is challenging incumbent Sen. Verna Jones-Rodwell (D 44). The new district contains roughly twice as many people from Nathan-Pulliam’s old district, though it bears Jones-Rodwell’s district number.

D10and44old2010 Baltimore City District 44 and Baltimore County District 10

Besides more past constituents, Nathan-Pulliam has more money in her campaign account–$80K to $63K for Jones-Rodwell. Neither can raise money during the session, so these are the amounts with which they will enter the final two months of the campaign.

Nathan-Pulliam has served in the House since 1995 and has been Deputy Majority Whip since 2003. Sen. Jones-Rodwell served one term in the House before winning election to the Senate in 2002 where she chairs a subcommittee of the powerful Budget and Taxation Committee.

Endorsements and slating can help either candidate. Nathan-Pulliam shows little sign of losing her base. Sen. Delores Kelly (D 10) has endorsed Nathan-Pulliam, her former delegate. Nathan-Pulliam also won the support of the 10th Democratic Club, much of which presumably now lives in District 44.

So far, I have not heard of any slates being formed (post on Facebook if you know otherwise). Nathan-Pulliam is older than Jones-Rodwell, who may find it easier to do the aggressive door knocking that she will need to do to introduce herself in Baltimore County.

Jones-Rodwell has fewer former constituents and less money than her opponent. Races like these often turn out to be friends-and-neighbors contests, especially when they straddle jurisdictional boundaries like District 44, so the incumbent is in real trouble. This is the first district I’m rating as favoring the challenger. Rating: Lean Nathan-Pulliam.

Share

Redistricting 2020

MD LD Plan 2012

Maryland’s Current Legislative District Plan

Is it ever too early to discuss the next cycle of redistricting?

The first elections for this decade’s plan are just being held this year since the 2010 elections occurred prior to the decennial redistricting wrangling.

But here at Seventh State, it’s never too early to look ahead, so I’ve taken a peek at the Maryland Department of Planning’s current population estimates for 2020. These estimates can only be taken as a rough basis not just because they’re estimates but because Maryland reallocates prisoners back to their home address for redistricting purposes.

Maryland has been at the forefront of addressing prison-based gerrymandering. The location of a large prison artificially boosts the population of an area even though none of its residents can vote. In Maryland, the allocation of prisoners from prisons in rural areas, such as from the three prisons in Allegany County, just happens to benefit Baltimore City.

Long the center of political power in Maryland, Baltimore City’s representation has declined rapidly in recent decades. The addition of prisoners from the City back into its population for redistricting purposes helps slow its steady loss of seats in the General Assembly.

Having mentioned these very large caveats regarding the reliability of the population estimates, here is what a look at the projected populations suggests for representation in the General Assembly in 2022:

Baltimore City will drop to five legislative districts. The City will gain people over the decade but at a slower pace than the rest of the State. Not enough to staunch the loss of political power. In other words, the new Baltimore City delegation will continue the City’s never ending game of political musical chairs, despite its mighty efforts not to cede representation.

In contrast, Frederick will gain enough population to incorporate the rest of District 4–its second district.

Montgomery will deserve more representation (roughly one-half of one delegate) but will remain close enough to eight districts that the number probably will remain unchanged. The big question is whether Rockville and Gaithersburg will be too large to stay together in one district. The law prohibits unnecessary violations of municipal boundaries, so this could necessitate redrawing the County’s whole map.

Prince George’s will lose roughly 40% of a delegate–almost exactly the share that neighboring Charles will gain.

While Calvert will see little change, St. Mary’s will come very close to no longer having to share a district with another county.

Howard should gain roughly 50% of a delegate–very close to the share than next door Baltimore County will lose.

Western Maryland (Garrett, Allegany and Washington) will retain its two districts with few changes.

Very little change for the nine counties on the Eastern Shore (Caroline, Cecil, Kent, Queen Anne’s Talbot, Dorchester, Somerset, Wicomico, Worcester).

Surprisingly, the numbers also project little change for the Baltimore exurbs of Carroll and Harford.

Remember that State law constrains the drawing of districts that violate too many county and municipal boundaries, except to satisfy the requirements of the federal Voting Rights Act. This limit will prevent any attempt to save Baltimore City’s political weight by drawing pizza pie districts out into the County that remain dominated by the City. The State tried this tactic during the 2000 round but the map was overturned in court.

Of course, these are really just guesstimates at this point. But it’s fun to peek ahead to Maryland’s political future.

Share