Maryland Presidential Analysis

The votes are still being counted in Maryland and across the country. While Trump has clearly won the Electoral College, whether he will carry the popular vote remains in doubt. In the meantime, let’s look at preliminary results in Maryland after last night’s political earthquake.

Though the earth didn’t move nearly as much in Maryland as elsewhere, there were significant changes in support patterns, which Clinton carried easily as expected. Here are the 2016 preliminary and 2012 final percentages side-by-side:

2016mdAs you can see the preliminary results, suggest that both candidates lost ground in Maryland. In order to more easily examine shifts across the state, I’ve created a table showing vote shifts by county with counties reordered by net change.

2016md2

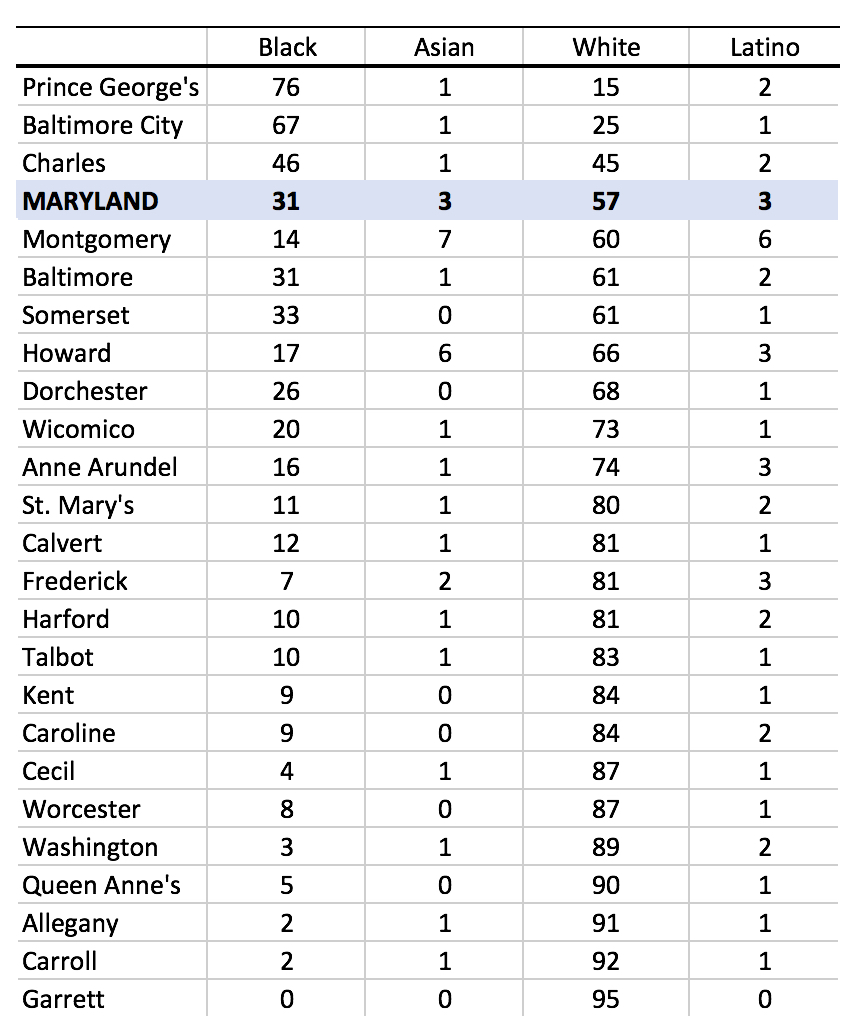
As you can see, Maryland shifted about a net 1.4% to Trump but that masks major differences across the State. The two counties with the most wealthy, well-educated, liberal white populations–Howard and Montgomery–shifted heavily to Clinton.

In these two counties, the Democrats had stunning net gains of over 10% of the vote, as Clinton gained 3% or more and Trump lost more than 7% in both Howard and Montgomery. Howard went 2-1 and Montgomery 3-1 for Clinton.

Another set of counties reveals the opposite pattern. In 14 counties, Clinton lost ground over Obama while Trump gained compared to Romney. Among the 14 counties, 11 have median incomes below the Maryland average–Calvert, St. Mary’s and Queen Anne’s are the exceptions, though none has a median income higher than Howard or Montgomery.

In addition to a tendency toward lower incomes, these areas tend to have fewer college-educated whites and be socially more conservative than Howard or Montgomery. Perhaps critically, pro-Trump counties tend to be far more suspicious of immigrants based on how they voted in the 2012 referendum.

The lowest rates of change were in the State’s two majority black jurisdictions of Baltimore City and Prince George’s, as well as more moderate jurisdictions like Frederick and Anne Arundel that tend to be closely divided between the two parties.

Overall, the key takeaway is greater geographic polarization between the Democratic and Republican areas of the State. In general, the areas that lean the most Democratic became more Democratic or stayed much the same. On the side, areas that already listed heavily Republican became more so.

Share

MoCo’s Two Electorates, Part Three

By Adam Pagnucco.

Part Two presented a host of demographic data comparing Democrats who voted in all three of the 2006, 2010 and 2014 primaries (“Super Dems”) to voters from all parties who voted in both of the 2008 and 2012 general elections (“Super Generals.”)  Let’s compare the two groups more concisely below.

In summary, when compared to Super Dems, Super Generals are more likely to:

  1. Be age 29 or younger.
  2. Be ages 30-39.
  3. Live in Clarksburg.
  4. Live in Damascus.
  5. Live in Germantown.
  6. Live in Council District 2.
  7. Live in Legislative District 39.
  8. Live in precincts that are 25% or more Asian.
  9. Live in Legislative District 15.
  10. Live in Montgomery Village.

When compared to Super Dems, Super Generals are less likely to:

  1. Be ages 70-79.
  2. Be age 80 or older.
  3. Live in Takoma Park.
  4. Live in Chevy Chase.
  5. Be ages 60-69.
  6. Live in Legislative District 20.
  7. Live in Bethesda.
  8. Live in Kensington.
  9. Live in Legislative District 18.
  10. Live in Council District 5.

The above items are ranked in order of likelihood.  So for example, the biggest difference between the two electorates is in age, but that is far from the only difference.

Super Dems are mostly from Downcounty, tend to be seniors or close to it, have a lot of voting history and may be majority liberal.  They elect MoCo’s county officials and state lawmakers, who tend to be responsive to them.  Super Generals are geographically diverse, younger in age, have less voting history and are much more diverse ideologically.  Liberals probably do not account for a majority of Super Generals.  It is the Super Generals, not the Super Dems, who decide charter amendments and ballot questions, including this year’s amendment on term limits.

Two more facts are relevant to Super Generals.

First, on the last three major county ballot questions, the general electorate voted in favor of stricter limits on property tax hikes, against the ambulance fee and against broad collective bargaining rights for the police union.  These were arguably the less progressive positions on all three questions.  If these questions were submitted only to Democratic primary voters, they may all have had different outcomes.

Second, a Washington Post poll in September found that MoCo voters from all parties together gave Governor Larry Hogan a 66% job approval rating.  This was not significantly different from the Governor’s statewide approval rating of 71%.  It’s hard to imagine a majority progressive electorate approving of an anti-tax GOP Governor to that extent, but this is further evidence that liberals may not in fact be a majority of MoCo voters.

Term limits is the issue of the day and will be decided soon enough.  But a broader question looms.  Given the differences between MoCo’s Two Electorates, what happens when elected officials cater to one of them at the heavy expense of the other?  The recent large property tax hike, which was spread all across county government, was aimed at the priorities of liberal Democratic voters.  It also became the core of the push for term limits which is aimed at the general electorate.  This suggests a need for balance and restraint by those running the government.  Because if one of the two electorates feels unheeded, either one has the tools to strike back – either by unseating incumbents or by shackling them with more ballot questions and charter amendments.

Share

MoCo’s Two Electorates, Part Two

By Adam Pagnucco.

In Part One, we began contrasting MoCo’s Two Electorates: namely, the Democratic primary voters who pick our elected officials, and the general election voters who decide charter amendments and ballot questions.  Today we present new data on the two electorates from the voter file.

We have integrated the January 2015 voter file available from the county’s Board of Elections with a variety of U.S. Census demographic data to analyze two groups of MoCo voters.  The first group, whom we call “Super Dems,” are those Democrats who voted in all three of the county’s 2006, 2010 and 2014 primaries.  The second group, whom we call “Super Generals,” are those voters from all parties who voted in both the 2008 and 2012 presidential general elections.  We would have also included 2004 voters if we could have, but the voter file doesn’t go back that far.  Presidential general election voters are relevant to this year, which is also a presidential year in which term limits are on the ballot.

Let’s look at a few demographics for Super Dems and Super Generals.

Party Affiliation

party-affiliation-two-groups

Super Dems are, of course, 100% Democrats.  Super Generals are 60% Democratic, 21% Republican and 18% others (most unaffiliated voters).  This matches the distribution of general election votes referenced in Part One.

Gender

gender

Both groups are majority female, with women being a slightly higher share of Super Dems.

Age

age

Super Dems skew towards seniors, with an average age of 64.  Super Generals are much more diverse on this measure, with an average age of 55.  While 19% of Super Generals are below age 40, only 3% of Super Dems are.  And while 63% of Super Dems are age 60 or older, only 39% of Super Generals are.  This means that while young voters are a meaningful voting bloc in general elections, they generally are not in MoCo Democratic primaries.  The difference in average date of voter registration in the county further emphasizes the deeper roots Super Dems have in MoCo than Super Generals.

Average Household Income

average-household-income

This is not a significant differentiator between the two groups, although this data masks real differences in residence geography.

Residence Type

residence-type

This is also not a significant differentiator.  Both groups overwhelmingly live in single family homes and a big majority of them are probably home owners.

Location of Residence

location-of-residence

Super Dems are more likely to live in Downcounty locations like Takoma Park, Chevy Chase, Bethesda, Kensington and Silver Spring while Super Generals are more spread out, including in Upcounty communities like Clarksburg, Damascus, Germantown and Montgomery Village.  This has ideological implications.  In this year’s Congressional District 8 primary, the very progressive Jamie Raskin ran up his biggest margins inside and near the Beltway, while the more moderate David Trone did best in northern areas.

District of Residence

district-of-residence

Once again, the geographic split between the two groups is obvious.  Fifty-four percent of Super Dems can be found in the two liberal strongholds of Council Districts 1 and 5, while Super Generals are more geographically balanced.  This may help explain why three of four At-Large Council Members come from Takoma Park.

Precinct Demographics

precinct-demographics

Race and ethnicity are not available from voter registration data, but we can examine those factors for the precincts in which voters live.  By this measure, Super Generals appear to be slightly more diverse than Super Dems.  This suggests a need for more outreach to people of color by the Democratic Party, which should be their natural home.

We will conclude in Part Three.

Share

MoCo’s Two Electorates, Part One

By Adam Pagnucco.

Montgomery County voters are some of the most progressive people in the nation.  They elect only Democrats, and almost all very liberal ones.  They celebrate diversity and respect civil rights.  They support a large, active government that passes liberal laws, provides excellent schools and generous social services and has extensive environmental programs.  Perhaps most importantly, they are willing to pay the taxes that support all of this.

Is the above a true statement?  Yes.  And maybe no.  It all depends on which electorate you’re talking about.  Montgomery County has two of them.

The first electorate is comprised of those Democrats who vote in the closed primaries for County Executive, County Council and members of the General Assembly.  Many of these are liberals who vote for candidates with similar views.  Indeed, there is an old aphorism that it’s nearly impossible to run too far to the left in MoCo elections.  Most elected officials here regard these voters as their political base and tend to be highly responsive to them.

But there is a second electorate: those residents who vote in general elections.  These voters come from all political parties and have significant ideological diversity.  For the most part, they tend not to reject the nominees of the Democratic Party for local and state office.  (The last Republican elected officials here were defeated ten years ago.)  But they can and do weigh in on charter amendments and ballot questions, and they do not always behave in accordance with the county’s progressive reputation.

This blog series examines the differences between these two electorates on the eve of the general election, when a landmark ballot question on term limits will be decided.  Of the two electorates, only one – the general election voters – will decide whether term limits will pass.

First, we examine the party composition of the two electorates.  The Democratic primary voters are of course 100% Democrats since Maryland uses closed primaries.  The general election voters are roughly 60% Democratic, slightly more than 20% Republican and slightly less than 20% unaffiliated or members of other parties.

party-affiliation

Are liberals a majority of the general electorate?  That’s hard to say, but a little math can help.  If just a fifth of the Democrats, who comprise 60% of general election voters, are not liberals, then a majority of the general electorate would probably not be liberal.  (There are a handful of Green Party members in MoCo, but not enough to change the basic math here.)  So while a majority of Democratic primary voters may be liberal, it’s difficult to apply that characterization to the entire electorate.

Another factor that can be easily seen from the data above is the relative size of the electorates.  There are about three times as many voters in gubernatorial general elections as there are in gubernatorial Democratic primaries.  Presidential general election voters outnumber gubernatorial primary Democrats by five to one.  So while Democratic primary voters pick our elected officials, the presidential general voters are a much closer gauge of the political sentiments of the entire community.

We will begin contrasting MoCo’s two electorates in Part Two.

Share

MoCo Board of Elections Responds to 7S Report on Early Voting Problems

The following was sent to 7S by Marjorie M. Roher, Public Information Officer of the Montgomery County Board of Elections:

Regarding “A Critical Error in Early Voting

The Montgomery County Board of Elections would like to take this opportunity to address the concern raised in “A Critical Error in Early Voting.”    Mr. Pagnucco’s description of the process that occurs in an early voting center is correct, and the Board appreciates his acknowledgement that the mistakes were honest.

Board staff learned of similar occurrences sporadically in several of the Early Voting Centers.  In each case brought to our attention, the voter received the correct ballot prior to scanning and was able to cast his or her vote in the appropriate congressional race.  The Election Director immediately contacted each Early Voting Center Manager to reinforce the need for accuracy in ballot distribution, instructed that Check-in Judges be reminded to circle the ballot style number on the Voter Authority Card (VAC) to make it easier to see, and Ballot Judges be reminded to double check the ballot style number on the VAC and ensure that they were issuing the correct ballot to each voter.  The design of the ballot issuance tables at each Early Voting Center was reviewed to ensure that the possibility of co-mingling ballot styles was eliminated.  Finally, a copy of The Seventh State blog was sent to each Early Voting Election Judge so that they might better understand the perception of the public when these types of errors occur.

All of these measures will assist in keeping errors to a minimum, but we urge voters also to pay attention to the ballot they are issued and, if they think they have the wrong ballot or if they have any other concerns regarding the voting process, speak to an election judge immediately so corrective action may be taken prior to scanning the ballot.  This will assist the election judges, who are voters who volunteer to work at election time to assist their neighbors with the voting process.

When the State Board of Elections selected the voting system to be used in 2016, it intended to utilize Ballot Marking Devices (BMD) at all Early Voting Centers.  This system would have allowed the Check-in Judge to hand each voter a ballot activation card with a bar code on the top, which  would contain the voter’s ballot style and, when inserted in the BMD, cause the correct ballot style to appear on the screen.  This would eliminate the need for an election judge to select the correct paper ballot for each voter.  Unfortunately, problems with how the BMD screen displayed contests with many names could cause voters to not see all candidates before voting.  For that reason, the State Board of Elections determined that the BMDs would only be used in 2016 by those individuals who requested them.

The State Board of Elections has requested the manufacturer of the BMD to modify the device so that all names in a contest would appear on the same screen.  We believe that this will be accomplished by 2018 so that all voters choosing to vote during Early Voting would be able to utilize this method, thereby eliminating the need for multiple styles of paper ballots at each location and the possibility of human errors.

The Montgomery County Board of Elections strives to ensure that each voter has a pleasant, efficient, and accurate voting process and we encourage voters to contact us with comments or suggestions for improvement, so that  we all can work together  to make a good voting experience even better.

Marjorie M. Roher
Public Information Officer
Montgomery County Board of Elections

Share

Early Voting Turnout Heavy Among Older and African-American Voters

Yesterday, I looked at the partisanship of early voters. Today, I take a peek of the age and racial demographics of early voters based on data graciously provided by a reader.

The estimates of the racial composition of the electorate are based on estimates of the race of voters with the caveat of the potential for errors. Not everyone named Morales is Latino just as not everyone called Goldberg is Jewish. Nonetheless, the information provide a useful first cut at who is participating in early voting.

Let’s start with the percentage of the electorate in each age group broken down by party:

partybyageEarly voters skew heavily towards older voters, especially among Republicans. At 74.4%, nearly three-quarters of GOP voters are over age 50. The Democratic share older than 50 is around 5% lower at 69.3%. Among all early voters, which includes unaffiliated and third-party registrants, the share is 68.9%, slightly lower than for Democrats. The low figure reflects much less skew towards older voters among non-major party voters.

In contrast, people 35 and under make up a low share of early voters–11.7% among all voters and just 11.4% among Democrats and 9.5% among Republicans. The latter figure reflects the heavy skew away from Republicans among millennials.

The next table shows the racial composition of each county’s electorate. Percentages add up to less than 100% because the race or ethnicity of many voters is unknown and cannot be reasonably gauged to any extent by proxies. As a result, the percentages presented here are invariably low end estimates.

countybyraceAmong early voters, African Americans are high participants (31%), exceeding their share of the voting-age population. Unsurprisingly, black participants overwhelmingly outnumber other groups in Prince George’s and Baltimore City. In Charles, African-American early voters barely edge out whites–a sign of the continuing evolution of racial demographics in that county.

The encouraging rates of black participation help explain why Democrats are consistently outperforming Republicans in early voting. Not only does Maryland have vastly more Democrats, they are voting at a higher rate than Republicans.

In contrast, Latinos (3%) and Asians (3%) appear to be casting early votes at low rates, reflecting lower rates of citizenship and turnout. Asians compose the highest share of early voters in Montgomery (7%) and Howard (6%). Latinos comprise 6% of early voters in Montgomery, and 3% in Anne Arundel, Frederick and Howard.

In Maryland as a whole, approximately 57% of early voters are white. Again, as the percentages are calculated out of total voters and many could not be placed in any category, the estimates for all racial groups are low.

Share