Regional Political Chasm Expands

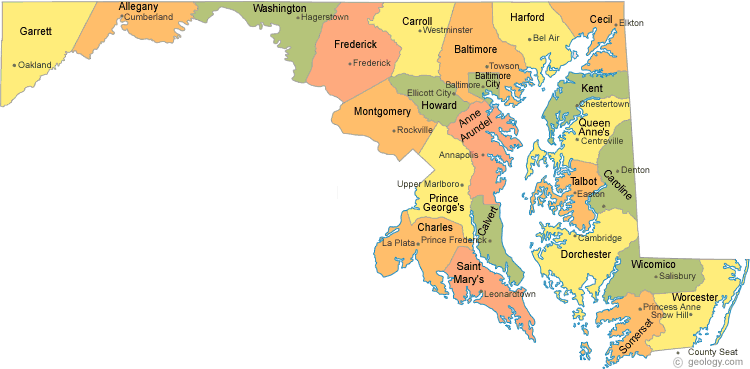
maryland-county-map

America in Miniature has very distinct political regions. I’ve divided Maryland into seven here. Republicans eliminated many of the remaining Democratic officeholders in 2014 in three rock-ribbed Republican regions–Western Maryland, Eastern Shore, and Outer Baltimore Bastions. Democrats retain iron grips on the Washington Suburbs and Baltimore City. These areas have very completely different interests and perspective on key issues facing the State.

Among the two remaining regions, Southern Maryland is really divided into two areas moving strongly in opposite directions, which just reinforces the divisions between the other regions. However, the four counties in the Swingy Outer Suburbs constitute the more marginal political territory in Maryland elections. Often up for grabs, Republicans advanced in 2014 through impressive gains in this important region.

Western Maryland

District 1 and 2 are located entirely within Garrett, Allegany, and Washington counties, and both will send entirely Republican delegations to the General Assembly. Their county commissions are also all one-party affairs. Hogan won between 75% and 80% of the vote in these three counties.

Eastern Shore

The Eastern Shore contains nine counties: Cecil, Kent, Queen Anne’s Dorchester, Caroline, Talbot, Somerset, Wicomico, and Worcester. Districts 35A, 36, 37, and 38 are located on the shore (the rest of D35 includes northern Cecil and will be discussed with Harford.) Unsurprisingly, Hogan did well here, taking between 65% and 80% of the vote in the nine Eastern Shore counties.

(Corrections made to this paragraph.) The Shore’s General Assembly delegation is heavily Republican. Majority-black District 37A’s sole delegate is the only Democratic delegate as compared to nine Republicans. Thanks to the political talent of Sen. Jim Mathias, the Democrats also hold one of the Shore’s three Senate seats. Republicans also dominate country government with 34 commission or council seats to just 11 for the Democrats.

Republicans hold all seats on the commissions or councils of Cecil, Queen Anne’s, Caroline, and Talbot Counties. They also form majorities in Wicomico and Worcester Counties. Democrats hang on to majority status by a single seat in Dorchester, Kent, and Somerset Counties–three of the Shore’s smaller counties.

Baltimore City

All six senators and sixteen delegates from the City are Republicans Democrats (Districts 40, 41, 43, 45, and 46 in their entirety as well as District 44A). The Democrats sweep city elections with similar regularity. Hogan won 22% of the vote in the City–not too bad really for a statewide Republican candidate.

Washington Suburbs

Montgomery and Prince George’s Counties are the two other large Democratic bastions. Together they contribute 16 senators and 47 delegates to the Democratic majorities in the General Assembly (Districts 14-27, 39, 47 but 27C is completely outside of Prince George’s). Democrats also easily mop up the seats on both county councils. Hogan received 37% of the vote in Montgomery but only 15% in Prince George’s.

Southern Maryland

The three counties of southern Maryland have been trending in two different directions. While growth, particularly that related to the Navy, has tilted Calvert and St. Mary’s increasingly Republican, growing African-American suburbanization has pushed Charles in the other direction.

Democrats now control the senator and three delegates from Charles (District 28) and hold all county offices. On the other hand, Republicans hold the one senator and four delegates elected entirely from St. Mary’s and Calvert (District 29 and District 27C), as well as completely dominate county offices. Hogan won 69% in Calvert and 73% in St. Mary’s. Though Hogan lost Charles, he showed surprising strength at 47% in a county that has gone for the Democrats by steadily increasing margins.

Swingy Outer Suburbs

Anne Arundel, Baltimore County, Frederick and Howard are  key pivots in state elections. All went for Hogan–52% in Howard, 59% in Baltimore County, 64% in Frederick, and 66% in Anne Arundel. All have mixed representation on their county councils with Howard heavily Democratic, Baltimore leaning Democratic, Anne Arundel leaning Republican, and Frederick heavily Republican. Republicans hold county executive seats in Anne Arundel and Howard while Democrats claim Baltimore County and Frederick.

Many of the more competitive elections for the General Assembly occur in these four counties, though there are also several solid legislative districts for each party. (Districts 3-4 in Frederick, Districts 6, 8, 10, 11, 42 and 44B in Baltimore, Districts 9, 12, 13 in Howard, District 30-33 in Anne Arundel.)

While Democrats lead 10-5 in Senate seats, they hold a smaller margin of 15-13 in House seats for these counties. Republicans picked up a several seats that Democrats had hoped to take in this region in 2014. Republicans have to continue to do well in these areas if they hope to make inroads in Maryland. All four counties have been moving towards the Democrats in presidential contests.

Outer Baltimore Bastions

Carroll and Harford Counties are Republican dream lands. Hogan was 82% in Carroll and 77% in Harford. Republicans control all county council seats in both places, as well as the executive in Harford.

Republicans now control all but one General Assembly seat, sending four senators and ten delegates to augment the GOP Caucuses. One Democratic delegate hangs on in District 34A. (District 5 is entirely within Carroll and 34 within Harford. District 7 straddles the Baltimore-Harford line but resembles Harford politically. District 35B is split between Cecil and Harford with 35A in Cecil.)

Share

Polarization Up in the Maryland General Assembly

Political scientists Boris Shor and Nolan McCarty have developed measures of state legislator ideology similar to the NOMINATE scores presented in yesterday’s post on congressional polarization. The Shor and McCarty scores are considered the best measures of state legislator ideology by political scientists and were developed through spatial modeling techniques that allow comparability both across states and years.

For individual legislators, more positive scores indicate greater conservatism while more negative scores indicate greater liberalism. The scores only range so low and high. A very rough indicator suggests that legislators with scores above 1 are especially conservative and legislators with scores below -1 are particularly liberal. Moderate legislators receive scores closer to zero.

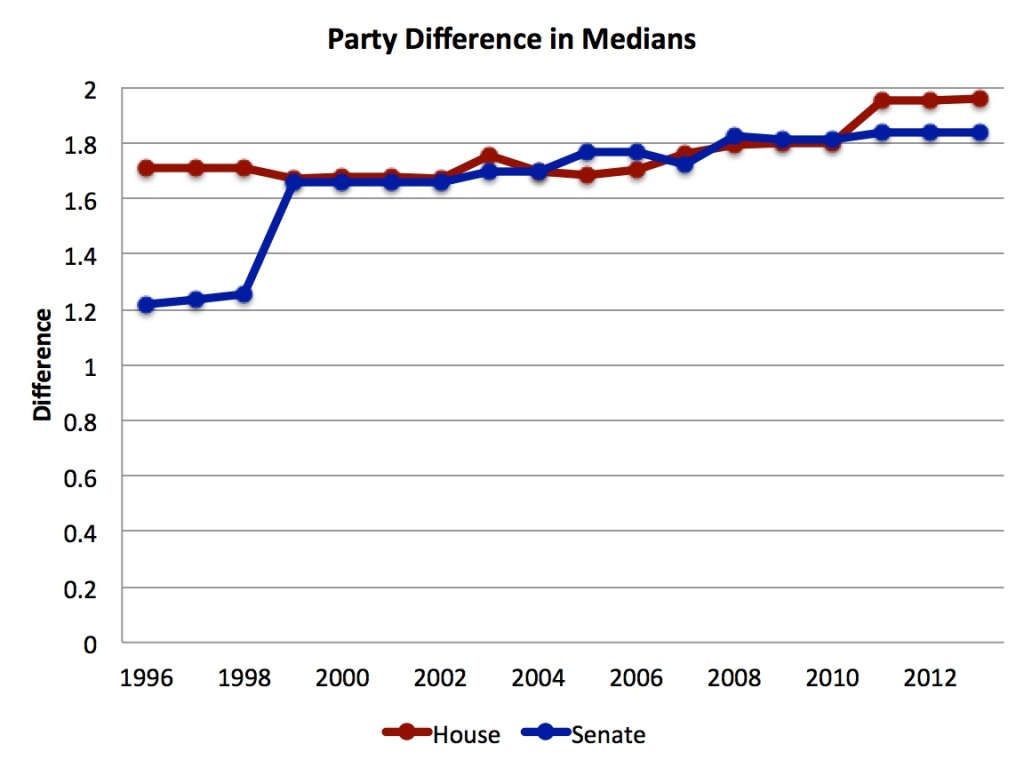
In both the House of Delegates and the Senate, differences between the median Republican and median Democrats in each chamber have widened over time , as the figure below shows. (If there were no difference in the ideology of each member, the difference measure would equal zero.)

MedianPartyDiff

Since 1996, partisan differences in the House of Delegates have increased from 1.71 to 1.96–a gain of 15%. The Senate started with lower polarization but has now almost caught up as differences rose from 1.22 to 1.84–a gain of 51%.

The rise in polarization is not due entirely to changes in the ideology of just Republicans or just Democrats. Republicans have become more conservative while Democrats have moved to the left. The median House Democrat is now 13% more liberal than in 1996 and the median House Republican is 17% more conservative.

HoDMedians

The same process has occurred in the Senate, though Republicans have lurched more to the right than Democrats have to the left. The biggest change occurred after the 1998 elections when several moderate Republicans were replaced by more conservative members of their party.

SenateMedians

Since 1996, Democratic liberalism has risen by 16%–a comparable change to that in the House–but Republican conservatism has shot up by 264%. This change is less drastic than it sounds. Senate Republicans in 2013 were still a tad less conservative than their counterparts in the House.

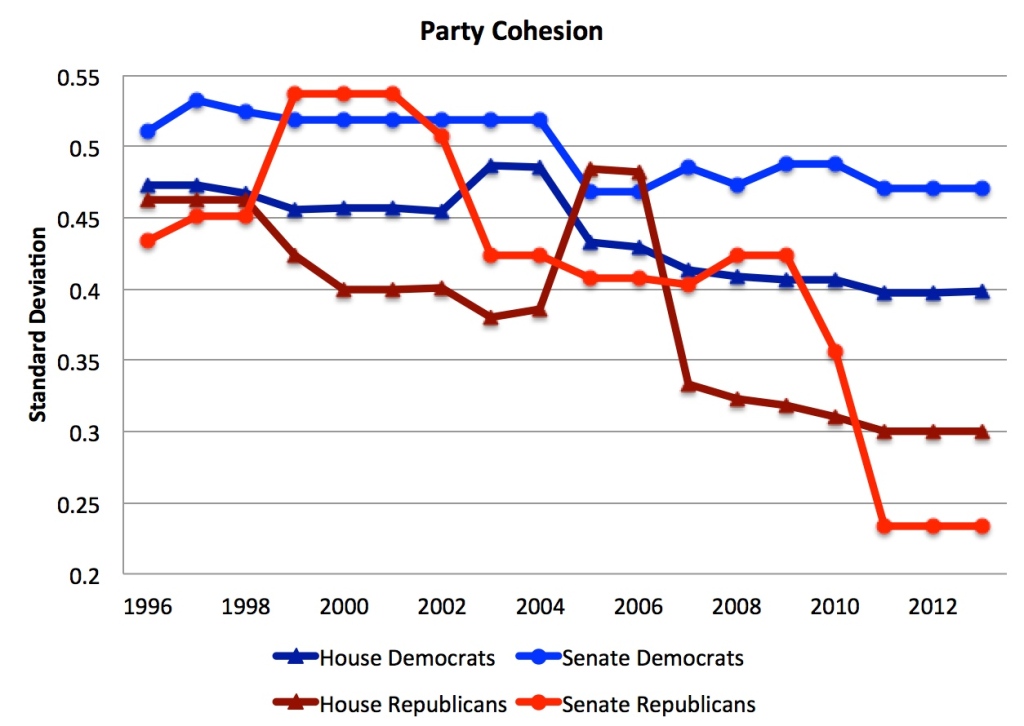
The party caucuses have not just become more ideologically different. They have also become more cohesive. The following figure shows the standard deviation in the Shor-McCarty scores for each year and party in both houses:

PartyCohesion

The decline in the standard deviation means that there is less variation around the average score for each party. In other words, Republicans are not just more conservative, they are also more cohesively conservative. The same is true for Democrats. But Democrats were much less cohesive than Republicans in 2013, reflecting that more moderate Democrats had survived than moderate Republicans.

Next up: the likely impact of the 2014 elections.

Share

Light Blogging

I’m leaving for Germany tonight to travel around for a week explaining the outcome and the implications of the midterm U.S. elections, so blogging may be lighter than usual. And, who knows, maybe I’ll write a little bit about Germany too.

Share

Why Polarization?

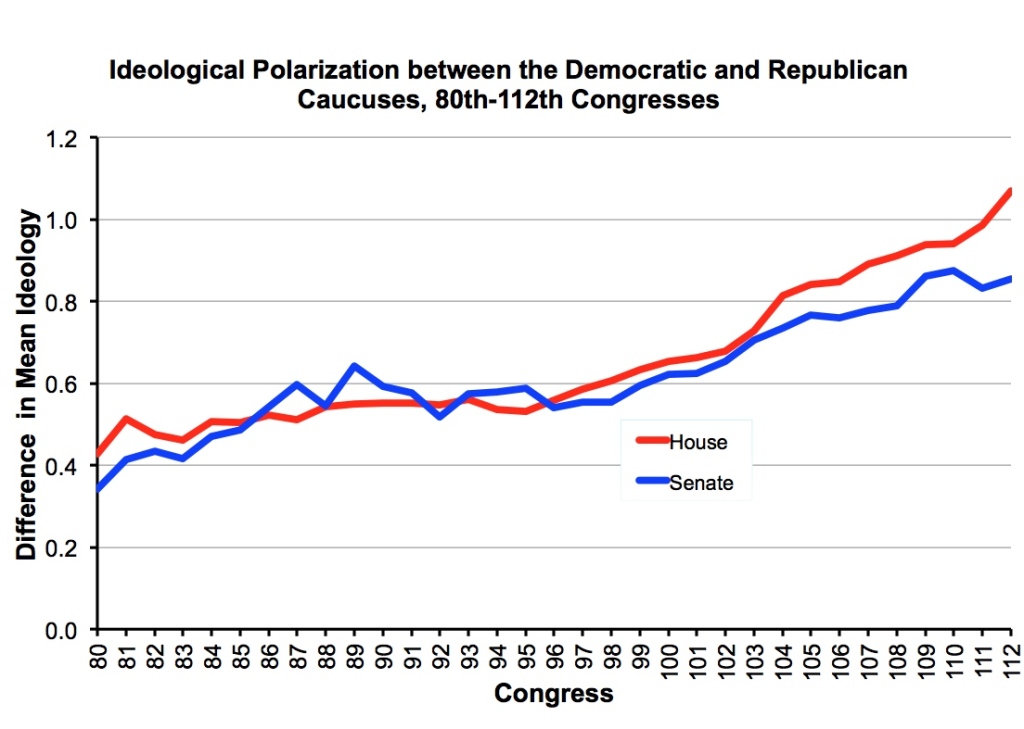
In the U.S., Democratic elected officials have become steadily more liberal while Republican elected officials have marched even faster in the conservative direction. As a result, polarization in the Senate and House of Representatives has increased:

PolarCong

The graphs show the difference in ideology between the average Democrat and average Republican over time–zero suggests no average difference in ideology according to the NOMINATE scores, which are widely used in political science. (UCSD Prof. Gary Jacobson, one of the country’s very top experts on Congress, kindly shared versions of these graphs with me.)

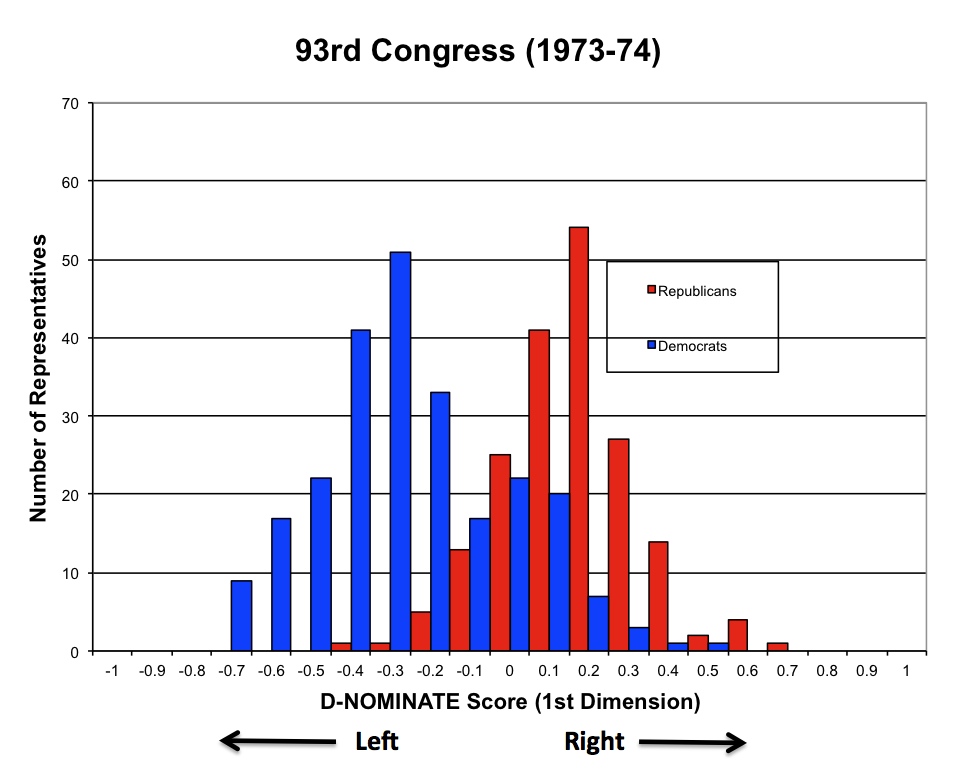
The increased polarization has resulted in the decimation of moderates in the House. Here is the distribution of representatives by party and ideology in the 93rd Congress:

Jacob93

According to the measure used here, right on the horizontal axis (i.e. more positive numbers) equates to greater conservatism while left on the same axis equates to liberalism (i.e. more negative numbers). Representatives with scores close to zero are relatively moderate.

In 1973-4, while Democrats tended to be more liberal than Republicans, there was still a lot of overlap between members of the two parties. A fair number of Republicans are more liberal than some Democrats. Similarly, many Democrats are more conservative than their Republican colleagues.

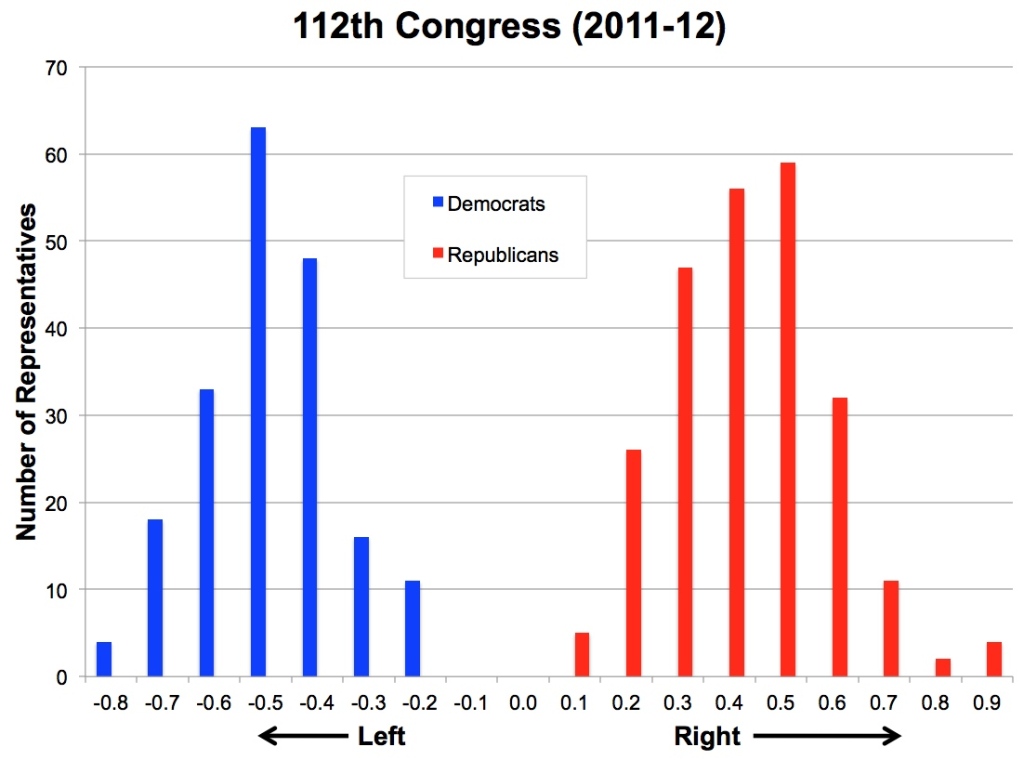
Now, look at the distribution for the House in 2011-12:

Jacob112

Not only is there no overlap between the two parties, there is even distance between the most liberal Republican and the most conservative Democrat. No wonder it is so hard to form bipartisan coalitions that can produce legislation in our divided government.

The new Congress will be even more polarized. The Democrats who lost tended to be among the most conservative members, such as Rep. Barrow from Georgia. Newly elected Republicans also tend to be more conservative than the colleagues that they replace.

Overall, both parties have become more extreme. The data indicates, however, that Republicans have moved twice as fast to the right as Democrats have to the left. But just because the Democrats have moved more slowly, does not mean that they will not eventually arrive.

Why is this happening?

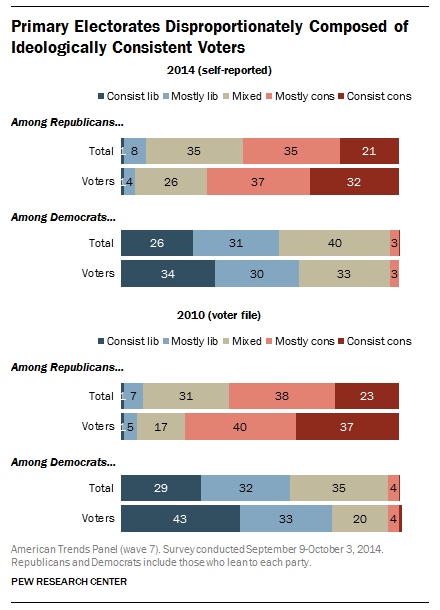
Many explanations are mooted to explain it but two factors have clearly played a major role: (1) the people who identify with each party are more ideologically homogenous, and (2) the people who vote in party primaries, and choose nominees, are more extreme than all members of their own party.

The following figure by Pew shows the composition of the primary electorates of both parties in 2010 and 2014. Among Democrats, 64% of primary voters were liberal in 2014 and 76% in 2010. Among Republicans, 69% of primary voters were conservative in 2014 and 77% in 2010.

The decline in extremism from 2010 to 2014 is illusory as the survey methods were different. Unlike in 2010, the 2014 survey utilizes self-reported voters but many survey respondents say they voted even though they did not and the non-voters are more likely to be moderates. Regardless, the primary electorates of both parties are more extreme than in past decades.

Primaries

Most representatives are from districts that are generally safe for one party or the other, so they naturally focus on the party primary–heavily skewed in one ideological direction.

But even fewer safe districts wouldn’t really undercut polarization. The ideological distribution of primary voters is such that nominees must cater to them even if winning the general election requires moderation. Marylanders should remember when liberal Del. James Hattery beat more moderate Rep. Beverly Byron in the 1992 primary. Hattery then promptly lost the seat to Roscoe Bartlett.

The same dynamics are occurring in Maryland legislative elections. The new Democratic caucuses in the General Assembly will contain more liberal and fewer moderate members than in past years. The retirees and the defeated are disproportionately among the more conservative Democrats (e.g. Dyson and James). Similarly, the Republican caucuses will also be more staunchly conservative. Republican retirees (e.g. Kittleman and Brinkley) were more moderate and willing to work with Democrats than their replacements.

Governor-Elect Hogan is going to have a difficult time navigating these political waters. In order for legislation to pass the General Assembly, it will require substantial Democratic support. However, the required compromises risk alienating conservative legislators who are opposed to arriving at accommodations with the Assembly’s liberal majorities even though it is vital to the operation of Maryland government.

The next four years will be many things but boring isn’t one of them.

Share

New Yorker on Hogan’s Win

The key paragraph from the liberal weekly on the Maryland gubernatorial race stunner:

But there is another, broader story about what happened to Brown, one that should make Democrats even more nervous and Republicans even more cheerful. The backlash against O’Malley and the implosion of Brown show how vulnerable Democrats are, still, to being identified as a party that is insufficiently interested in economic growth and insufficiently allergic to taxes. A popular candidate or a sudden crisis might shift voters’ attention elsewhere, but the issue of taxation doesn’t tend to stay out of the spotlight for too long. Even in deep-blue states, voters have the sense that Democratic politicians don’t hate taxes as much as they do. And sometimes it doesn’t take much—maybe only thirty-nine dollars—to remind them.


Share

Redistricting Forum at UMD

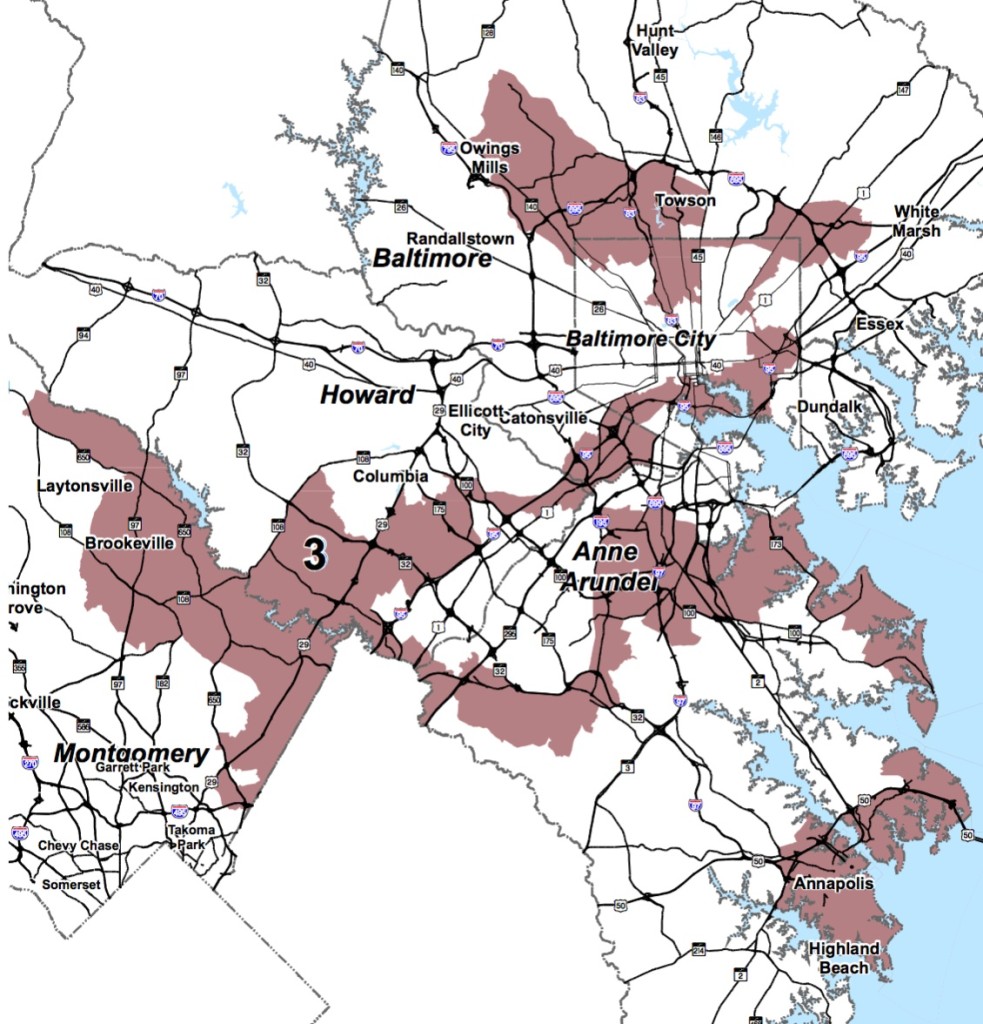
CD3

Redistricting Reform in Maryland: Challenges and Solutions Forum to Analyze Next Steps for Reform in Maryland, Nationwide

The Tame the Gerrymander coalition will hold a public forum focused on efforts to replace gerrymandering with a fair and open process to draw congressional and state-legislative district lines. Speakers will include Congressman John Delaney of Maryland, Maryland Delegate Aisha Braveboy and Dan Vicuna, the National Redistricting Coordinator for Common Cause.  Speakers at the forum, all veterans of the uphill battle against gerrymandering, will discuss the problem with the current system and possible solutions that are introduced in Congress and working in states across the country.

The event is being hosted by the Norman and Florence Brody Public Policy Forum at the University of Maryland School of Public Policy and is a project of Common Cause Maryland, the League of Women Voters of Maryland, and the National Council of Jewish Women Annapolis Section.

The forum is a follow-up to “The Gerrymander Meander,” a 225-mile relay last month in Maryland’s 3rd Congressional District to highlight the need for reform.

When: November 10th; doors open 5:15 (light refreshments will be served)

Forum starts at 6:00pm.

Where: Executive Dining Room, 2517 Van Munching Hall

School of Business, University of Maryland College Park

(From Campus Drive, turn right at the circle onto Mowatt Lane. Follow signs to Visitor Parking. Van Munching Hall is on your left; free parking is available on the left in Mowatt Lane Parking Garage.)

Who:   Doug Besharov, Moderator and Host (Norman and Florence Brody Professor, UMD School of Public Policy)

Congressman John Delaney (Congressional 6)
Delegate Aisha Braveboy (Legislative 25)
Dan Vicuna (National Redistricting Coordinator, Common Cause)


For more information, contact:

Jennifer Bevan-Dangel, 410-303-7954, jbd@CommonCause.org (Common Cause Maryland)

Nancy Soreng, 301-642-5479, nsoreng@comcast.net (League of Women Voters of Maryland)

Share

Popping Democratic Myths

Democrats are still trying to figure out why they lost the gubernatorial election. Naturally, this process will continue for some time. But Democrats might as well begin by dispensing with some of the popular but unhelpful myths floating around.

1. Hogan’s Election was a Fluke

Some Democrats seeking comfort in the results have concluded that it was a bad year for Democrats and assume matters will revert to normal soon enough. Population shifts towards the Washington area and minority groups make this inevitable. This myth makes Republicans gleeful as it invites further complacency among Democrats rather than a serious assessment.

2. Democrats Needed a More Progressive Candidate

In an odd cracked mirror reflection of Republicans who think that John McCain and Mitt Romney were not conservative enough, this myth’s advocates contend that the base wasn’t excited because Anthony Brown was not sufficiently left wing. But it’s just not credible that Brown would have won more votes through advocacy of greater spending hikes for government programs and the taxation needed to pay for them.

3. If Only Brown had Run a Positive Campaign

Negative advertisements can be quite effective. Politicians and political consultants don’t use them because they are nasty people with twisted souls. Consider Governor-Elect Hogan’s relentless attacks on tax increases by Governor O’Malley.

Like most good myths, the one contains a kernel of truth in that improvements could have been made to the campaign, including a stronger case as to why to vote for Brown and a vibrant defense of the accomplishments of the O’Malley-Brown administration. Moreover, the negative ads on choice failed to convince because Hogan made clear he considers this a settled question.

Del. Heather Mizeur argued most passionately for strictly positive campaigns, most pointedly in her Baltimore Sun opinion piece. But though lamenting negative campaigning, the piece feels like one long negative attack on the man who beat her in the primary, which rather undercuts her central point.

4. The Message is Fine

As several Democrats have said forthrightly, voters in Maryland chose the correct candidate if they don’t want further increases in taxes to provide for more progressive policies. Except that they say this not realizing that this is exactly why people were ready for a change. Hogan campaigned for tax reduction and less regulation and Marylanders liked it.

Perhaps their sentiments will change after a certain amount of time moving in the other direction. But Democrats should fear that Hogan’s mix of moderation of social issues and economic conservatism could prove powerfully attractive, particularly if he pursues it in a practical and balanced way.

Again, Democrats have fallen into the Republican trap. Many Republicans view that taxes can never be cut too low with religious fervor (e.g. Sam Brownback in Kansas) and fail to recognize that taxes are needed to provide for government services that are broadly supported such as education. However, the number of Democrats who view ever higher increases in taxation as desirable and wise with a parallel ideological fervor has grown.


I look forward to hearing the ideas that Democrats have for moving forward even as they analyze past mistakes. While change can be difficult, adjustments could prove easier than expected and help Maryland–and not just the Democrats–make progress.


Share

GOP Moves Forward in Six Counties

The Republicans had a good Tuesday night, capturing the governor’s mansion and making gains, albeit limited, in both houses of the General Assembly. The GOP also made gains in six counties. Summing up the night–they went from 25% to 44% of county executives and from 54% to 56% of council seats.

The most exciting pickups for the Republicans are the two county executives, including taking the top chair in red-leaning Wicomico, But the Republicans had a real coup with Alan Kittleman’s victory in Howard–an increasingly Democratic county that went for Hogan as well as Kittleman.

County Councils

Republicans also made gains in four county councils: Baltimore, Harford, St. Mary’s, and Talbot. In the latter three, the Republicans knocked all of the remaining Democrats by taking their last two seats in Harford and one seat in St. Mary’s and Talbot. In Baltimore, the Democratic majority shrank from 5-2 to 4-3 with the loss of retiring Councilmember John Olszewski Senior’s seat.

The one bright spot of the night was Frederick. Though the two Democratic Youngs won, the tea-party Republican son of Sen. Young lost the battle to become Frederick’s first county executive. The Democrats also picked up two seats on the new expanded Council. One Republican seat is sufficiently close that there is an outside chance that absentees could flip it to the Democrats.

The same four jurisdictions completely dominated by the Democrats before the election–Baltimore City, Charles, Montgomery, and Prince George’s–remain so afterwards.  Republicans wholly controlled eight counties before the election: Allegany, Calvert, Caroline, Carrol, Cecil, Garrett, Queen Anne’s, and Washington. They have now added three more with Harford, St. Mary’s, and Talbot for a total of 12–a majority of all of the 23 jurisdictions, though certainly not the most populous ones.

The partisan state of play remains unchanged in purple Anne Arundel, Dorchester, Kent, Somerset, and Worcester. Anne Arundel will have the interesting challenge of dealing with secessionist theocrat Michael Peroutka on the Council. And just when they hoped things were finally settling down after the rather eventful departure of disgraced County Executive John Leopold.

No Councils flipped control. However, Howard’s Democratic majority will face a Republican executive, while Wicomico now has unified government with a Republican executive and council.

Share

2014 v. 2012 Results from Around the Country

The following three tables compare the results in House, Senate, and Governors races with the presidential results in 2012.

The first chart shows all 17 U.S. House districts that have flipped parties. Republicans gained four seats that Romney won but also made inroads by winning 11 seats that Obama carried. Republicans lost two seats–one centered on Omaha and the other on Tallahassee. In Nebraska’s Second District, the incumbent made the mistake of saying that he didn’t think he should have to give up his salary during the government shutdown.

Flipped U.S. House Districts

FlippedHouse

The next chart shows the results of key U.S. Senate races. I’m assuming that Landrieu loses the runoff in Louisiana since the two Republican candidates won 55% of the vote. Additionally, I lumped Orman in Kansas with the Democrats.

The GOP picked up nine Senate seats. Except for Colorado and Iowa, the winning party is the same as the state’s 2012 presidential winner.

Key U.S. Senate Races

SenateResults

The final chart shows results in key gubernatorial elections. As you can see, Republicans made inroads in several other blue states. But Maryland is the bluest state that elected a Democratic governor and Hogan won by more than other Republicans who were reelected or picked up governor’s mansions in blue states.

Key Gubernatorial Races

GovResults

Share

General Assembly Results

Based on results from last night, Republicans have made limited gains in the new General Assembly: two seats in the Senate and seven seats in the House of Delegates. Veto overrides take 3/5 in each House–29 in the Senate and 85 in the House. As a result, there are not enough Republicans to sustain a gubernatorial veto with support from at least some Democrats.

Here are the tentative General Assembly results:

newgenlassem

Share

Maryland Politics Watch