
Today, I am pleased to present a guest post by Adam Pagnucco:
Who are these registered MoCo Democrats who don’t vote? Let’s find out.
The table below presents data on registered Montgomery County Democrats from the January 2015 voter registration file. As of that date, there were 360,427 registered Democrats in MoCo. The file contains their voting histories in the primary and general elections from 2006 on. Most MoCo Democratic candidates running in primaries, which tend to decide elections here, concentrate their voter contact on the 42,692 people who voted in each of the last three primaries. (They account for 12% of MoCo Dems and 5% of the county’s voting age population.) But for the purpose of this analysis, we will be examining three groups: all registered Democrats, those who voted in each of the last three gubernatorial general elections (Super Dems) and those who have voted in no gubernatorial generals (Non-Voting Dems).

The first fact that stands out is that the non-voters are a larger group than the super-Dems. There were 98,791 Democrats in the file who voted in each of the 2006, 2010 and 2014 general elections. But there were 127,851 Democrats who did not vote in any of them. That fact alone should worry state and county Democratic strategists who are looking to generate more turnout to defeat Governor Larry Hogan.
Another fact that stands out is that of the 127,851 Democrats who did not vote in any of the gubernatorial generals, 73,306 voted in at least one of the 2008 and 2012 presidential elections. This group accounts for 20% of all MoCo registered Dems. Why are they voting for President and not for Governor? Let’s remember that Hogan’s statewide victory margin in 2014 was 65,510 votes. If half of these presidential-voting Democrats showed up in 2014 and voted for Anthony Brown, Hogan’s margin would have been cut by more than half. If half of all of the non-voting MoCo Dems had showed up to vote for Brown, Hogan’s margin would have been nearly eliminated.
Let’s zero in on a few demographic factors pertaining to MoCo Dems.
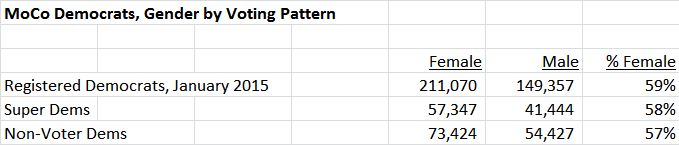
Gender
Women account for majorities of registered MoCo Dems, super-Dems and non-voters. No surprise here. Women dominate the rank and file of the Democratic Party even if they account for less than a majority of its elected officials.
Age
Age is the single most meaningful variable differentiating super-Dems from non-voters. The average age of super-Dems is 61. The average age of non-voting Dems is 39. Fifty-three percent of super-Dems are age 60 or older. In contrast, sixty percent of non-voting Dems are 39 or younger.
Here’s a different way of looking at age. Following are the turnout rates for Democrats by age group in the 2014 general election.
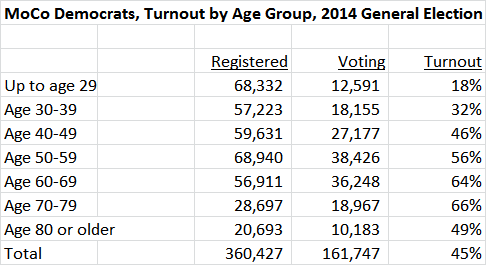
Democrats in their 60s and 70s were at least twice as likely to vote as Democrats in their 30s or younger. Nearly 100,000 MoCo Dems in their 30s or younger did not vote in the 2014 general.
Low turnout among young people is not exclusive to MoCo – it’s a nationwide phenomenon. But because so many young Democrats in MoCo are not voting, that suggests the party needs a strategy to get them to the polls to realize significantly higher turnout in 2018.
We will look at more differences between super-Dems and non-voters in Part Three.
