
What factors are linked to high COVID-19 infection rates in Maryland counties? Is it race? Is it income? Is it population density? Is it political affiliation? Today, I look at the impact of all of these factors both individually and collectively.
One word of caution: forming conclusions about individuals from countywide data is perilous. Nevertheless, it’s a useful exercise to gain a greater sense of what is happening in our state.
The Big Impact of Race and Ethnicity
Let’s start with race. The share of non-Hispanic Whites is negatively related to COVID-19 case rates. Increasing the White share of the population by 10% is associated with a decrease in 190 COVID-19 cases per 100k.
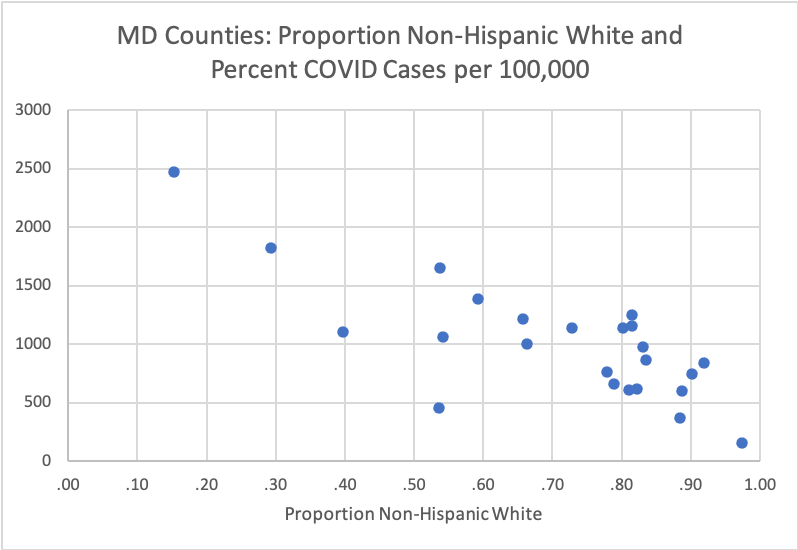
Conversely, there are strong positive relationships between the share of Non-Hispanic Blacks and Hispanics with higher COVID-19 case rates. Here are the charts:

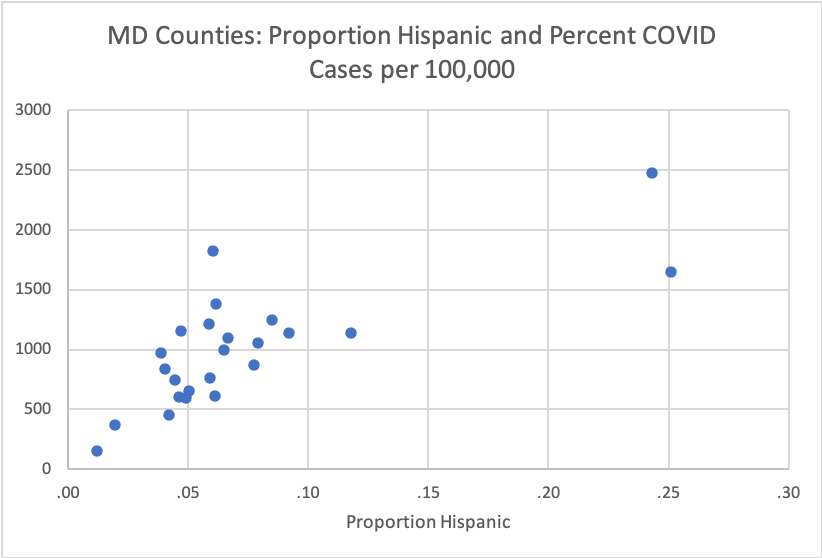
A model that controls for both simultaneously indicates that increasing the Black share of the population by 10% is associated with an increase of 125 COVID-19 cases per 100k. For Latinos, a similar increase is associated with an astonishing increase of 470 cases per 100k.
There is no significant positive or negative relationship between the share of non-Hispanic Asians and COVID-19 rates. Bear in mind that only Howard and Montgomery Counties are more than 7% Asian.
Population and Density
The following chart shows the relationship between the number of people in a county and COVID-19 rates. Interestingly, the relationship is stronger than if one uses population density instead.
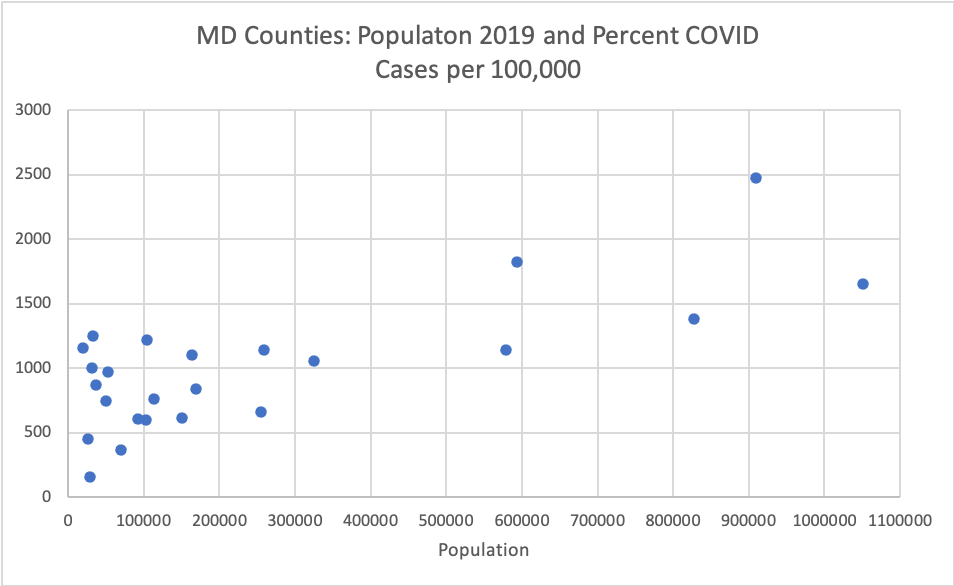
However, if one controls for the share of Blacks and Latinos, neither total population nor density has a statistically significant effect on COVID-19 case rates across Maryland counties.
Trumpiness Doesn’t Matter
Voting for President Trump in 2016 might be associated with lower infection rates because his voters were overwhelmingly white and also are more likely to live in low population, rural areas. At the same time, Trump’s followers are more likely to believe coronavirus is a hoax and to shun lifesaving behaviors, like wearing masks.
An initial look at the simple relationship between Trumpiness and COVID-19 rates suggests that the racial effect predominates:
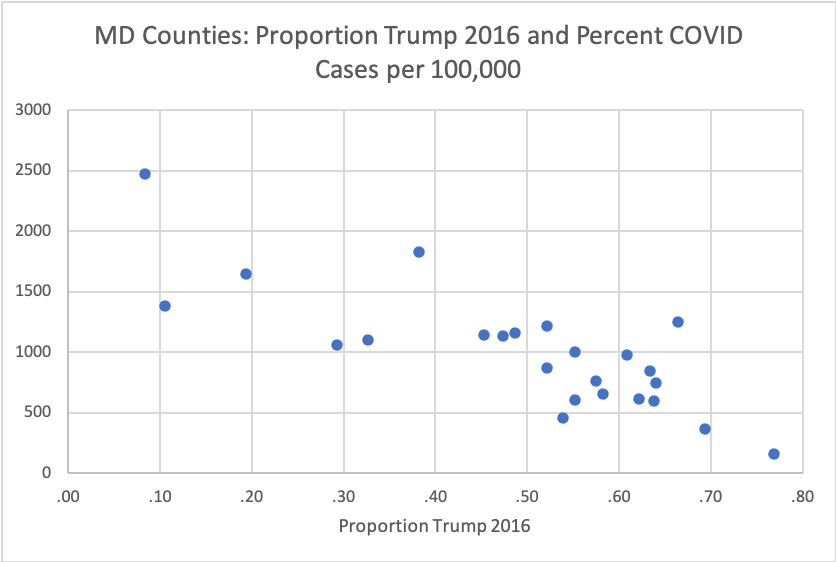
Conducting a multivariate analysis that controls for multiple factors simultaneously confirms this conclusion. Once one controls for race, there is no statistically significant relationship between the share of the vote for Trump in 2016 and COVID-19 case rates. Of course, one should be careful at extrapolating from this county level data to the impact of individual-level behaviors related to voting choices.
I also looked at median household income. As I expected, this didn’t matter much. I don’t set much store in this result, however, because median household income varies far less across large aggregate units like counties than between individuals and often has little impact in these sorts of analyses in my experience.
One more caveat: these are the relationships based on the data as of today. As infection spreads to different parts of the state–portions of the Eastern Shore are getting hit now–they could change over time.
