 Earlier today, I published a piece arguing that there is no blue wave based on the early voting statistics. One reader pointed out on twitter that information about whether there was a wave could be better gauged by comparison with the past. After all, young voters could have closed the gap even if they remain behind older voters.
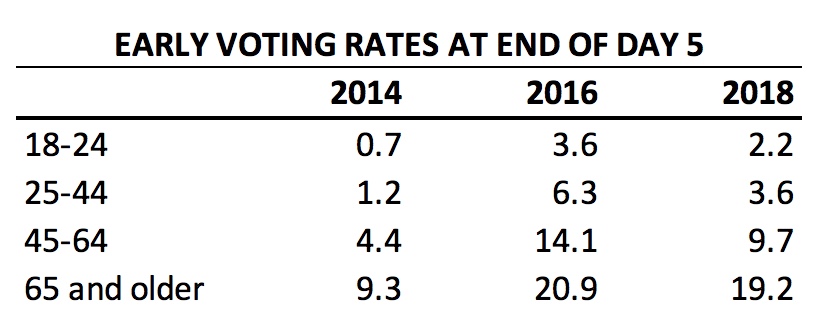
In order to provide a better basis for examination, I calculated early voting rates at the end of the fifth day of early voting for 2014, 2016 and 2018, which are shown in the above table. I used the same method as described in the post earlier today.
I suppose an optimistic reader might point out that early voting among 18-24 and 25-44 voters is three times higher than the abysmal turnout of 2014, a year when Democrats were unmotivated and demobilized.
That comparison seems a bit facile when you consider that the absolute turnout rates remain low. Three times more of a very small number is a slightly less small number. As of now, it means 8,111 18-24 year olds have voted than in 2014.
Comparisons with 2016 are less favorable. The share of early voters in the two youngest cohorts is only around 60% as large as at the same time during early voting in 2016. That was a presidential year, so we naturally expect turnout to be higher despite the absence of the panoply of state and local offices up at midterm.
At the same time, when Ben Jealous said Democrats needed a more progressive candidate to inspire higher turnout, I don’t think that the former co-chair of Bernie Sanders’s campaign was suggesting that he could do about 60% as well as Hillary Clinton.
Moreover, the older cohorts are much closer to turning out at 2016 rates than the younger cohorts. The 45-64 cohort has so far turned out at 69% of the rate of 2016. Even more impressively, the 65 and older cohort has seen very little drop off. The share of voters among seniors who voted is 91% of 2016 rates.
While the other age cohorts turnout rates appear roughly in the middle of their 2014 and 2016 turnout rates, the rate for seniors is clearly far closer to the much higher 2016 rates. Don’t forget that this group also a had a far higher bar to meet.
Comparing the difference between turnout rates for the oldest and youngest cohorts tells a similar story. In percentage points, older voters participated in early voting 8.6% more in 2014, 17.3% more in 2016, and 17.0% more in 2018.
The changes from 2014 to 2018 are even more dramatic. Yes, the youngest voters increased their turnout from 0.7% to 2.2%. But older voters jumped from 9.3% to 19.2%. That’s a gain of 9.9% as opposed to a gain of 1.4%.
In short, the evidence doesn’t support the conclusion that young Maryland voters are highly “energized” and eager to vote compared to other age cohorts, as claimed by the Jealous campaign. In early voting, it’s not the young but the old who are showing the way.
It’s not a youthful blue wave. It’s a senior tsunami.
