
By Adam Pagnucco.
In Part Three, we saw that MoCo’s problem of taxpayer flight is shared by most jurisdictions in the Washington region. But what happens when we look at MoCo’s taxpayer inflows and outflows to and from each of its large neighbors? From whom does MoCo gain income on net? And to whom does MoCo lose income on net?
We looked at net gains and losses between MoCo and nine other local jurisdictions plus two states. Let’s start with the two jurisdictions from which MoCo has net gains of taxpayer income: D.C. and Prince George’s.
District of Columbia
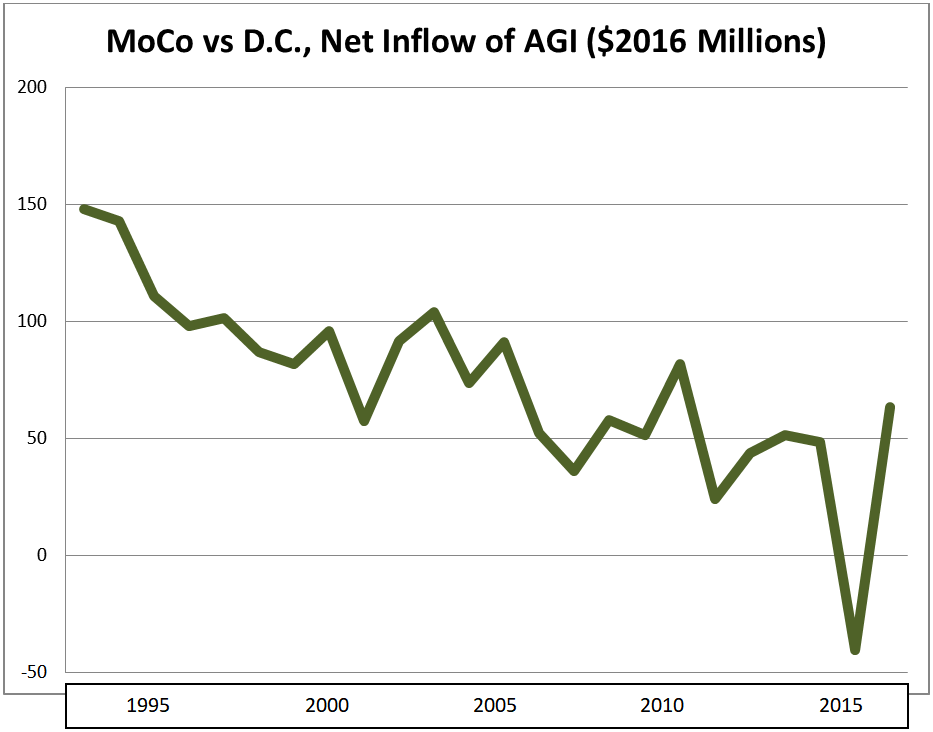
Net change in tax returns, 2006-2016: +1,070 (inflow)
Net change in adjusted gross income ($2016), 2006-2016: +$417 million (inflow)
Adjusted gross income of in-migrants ($2016), 2006-2016: $94,696
Adjusted gross income of out-migrants ($2016), 2006-2016: $83,038
Migrant income gap: In-migrants earned 12% more than out-migrants
MoCo almost always drains tens of millions of dollars in taxpayer income each year from D.C. That’s because it gets more in-migrants from D.C. than out-migrants and the in-migrants make more. This fits a pattern of young people living in D.C. and then moving to the suburbs as their incomes grow and they are ready to have kids. However, as D.C.’s economy has improved since the 1990s, the District’s net income flow to MoCo has diminished over time. In 2015, D.C. even netted a gain of $40 million from MoCo, the first time the District ended up on the plus side of this ledger since this data series began in 1993.
Prince George’s County
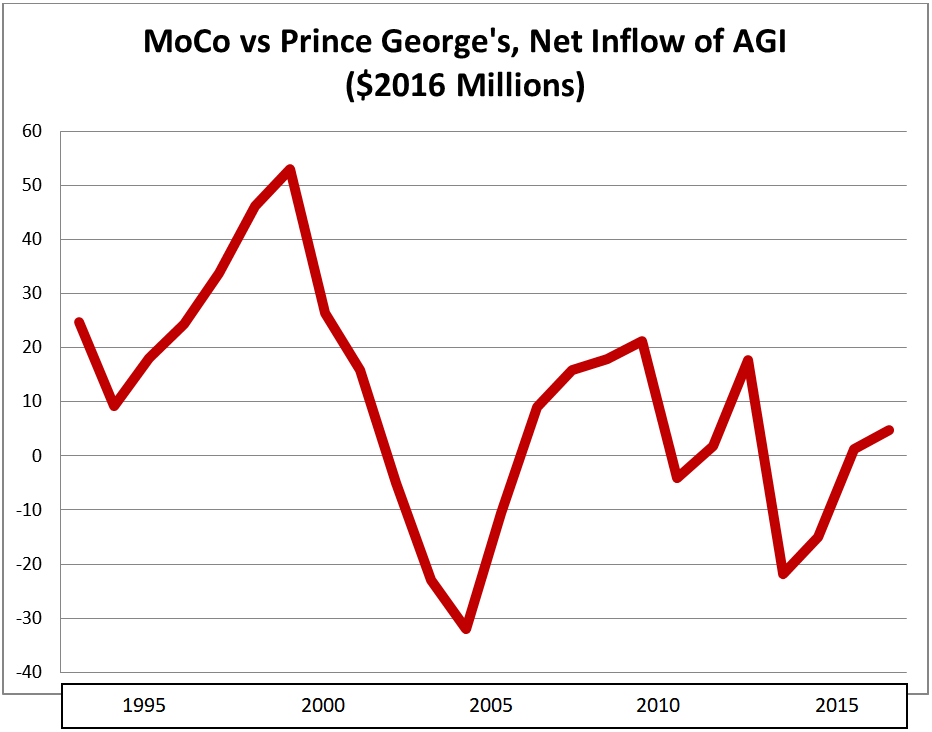
Net change in tax returns, 2006-2016: +834 (inflow)
Net change in adjusted gross income ($2016), 2006-2016: +$39 million (inflow)
Adjusted gross income of in-migrants ($2016), 2006-2016: $42,894
Adjusted gross income of out-migrants ($2016), 2006-2016: $42,802
Migrant income gap: In-migrants earned about the same as out-migrants
In the 1990s, MoCo consistently enjoyed positive income inflows from Prince George’s, but that began to change in the 2000s. In the last fifteen years, MoCo lost money to Prince George’s seven times. MoCo may still have a slight advantage but it’s very tenuous and could slip away.
Alexandria City
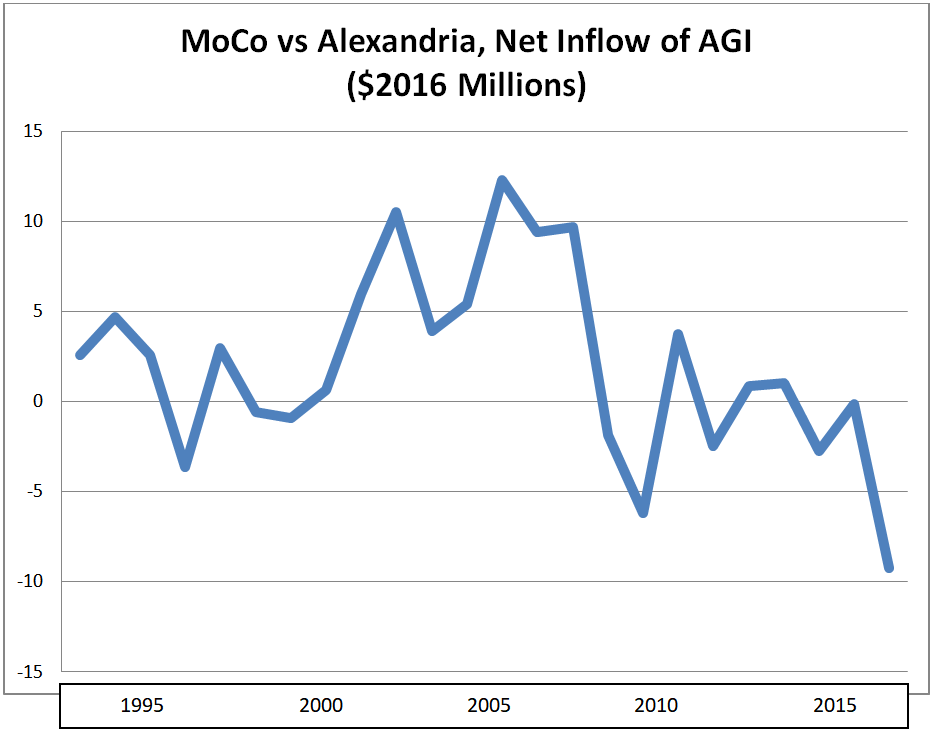
Net change in tax returns, 2006-2016: -346 (outflow)
Net change in adjusted gross income ($2016), 2006-2016: -$7 million (outflow)
Adjusted gross income of in-migrants ($2016), 2006-2016: $78,961
Adjusted gross income of out-migrants ($2016), 2006-2016: $73,304
Migrant income gap: In-migrants earned 7% more than out-migrants
There’s not a ton of migration between MoCo and Alexandria and the two jurisdictions roughly break even, although MoCo’s balance has deteriorated a bit in recent years.
Arlington County
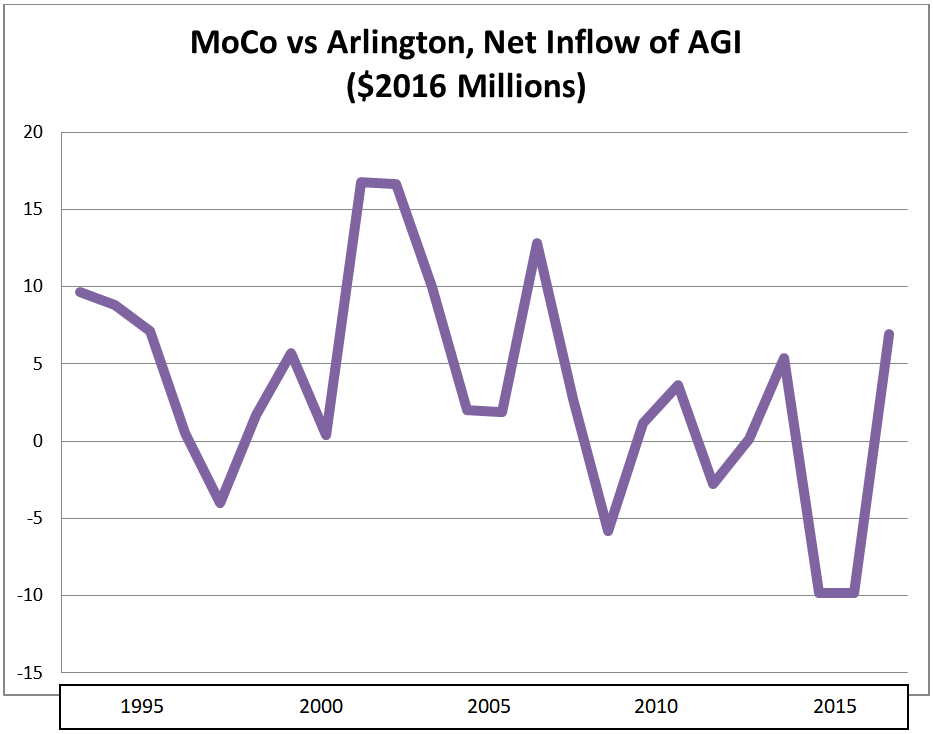
Net change in tax returns, 2006-2016: -1,103 (outflow)
Net change in adjusted gross income ($2016), 2006-2016: -$8 million (outflow)
Adjusted gross income of in-migrants ($2016), 2006-2016: $85,154
Adjusted gross income of out-migrants ($2016), 2006-2016: $72,852
Migrant income gap: Out-migrants earned 14% more than in-migrants
As with Alexandria, MoCo roughly breaks even with Arlington. Again, MoCo’s balance has gotten slightly worse in recent years.
Prince William County
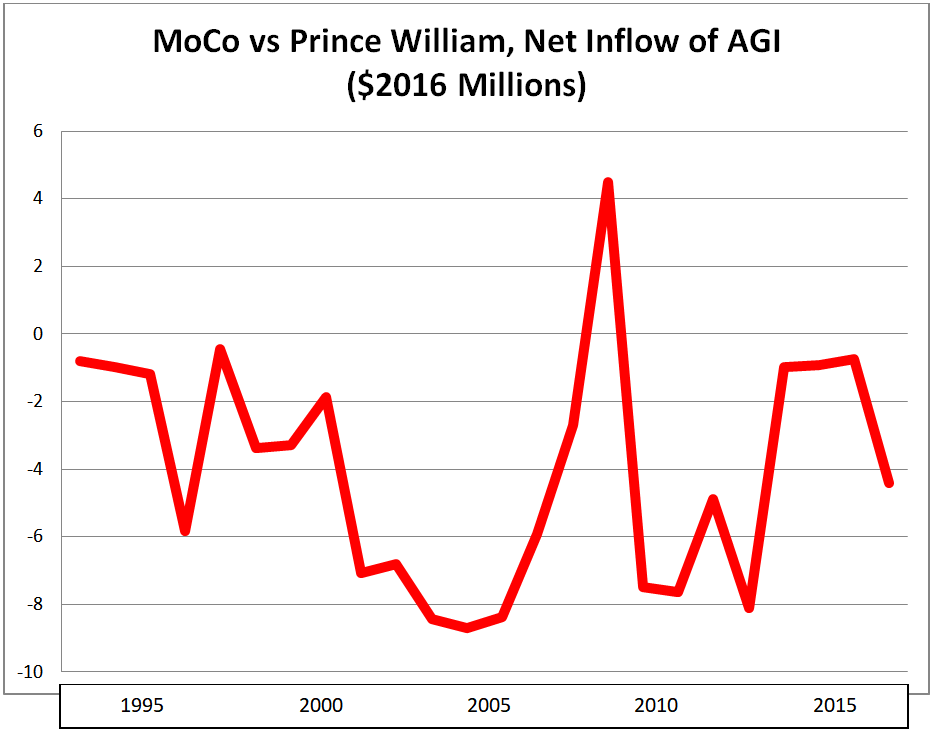
Net change in tax returns, 2006-2016: -289 (outflow)
Net change in adjusted gross income ($2016), 2006-2016: -$33 million (outflow)
Adjusted gross income of in-migrants ($2016), 2006-2016: $50,076
Adjusted gross income of out-migrants ($2016), 2006-2016: $57,436
Migrant income gap: Out-migrants earned 15% more than in-migrants
Prince William has received small inflows of income from MoCo that have diminished in recent years. Most people moving between the two counties fall in the lower end of the region’s income distribution.
We will conclude tomorrow.
