
By Adam Pagnucco.
As we stated in Part One, the IRS tracks the inflow and outflow of returns, exemptions and adjusted gross income (AGI) for all states and counties. Comparable data starts in 1993 and continues through 2016. Here is what that data looks like for Montgomery County.
First, let’s look at the inflow and outflow of tax returns, which approximate the number of households.
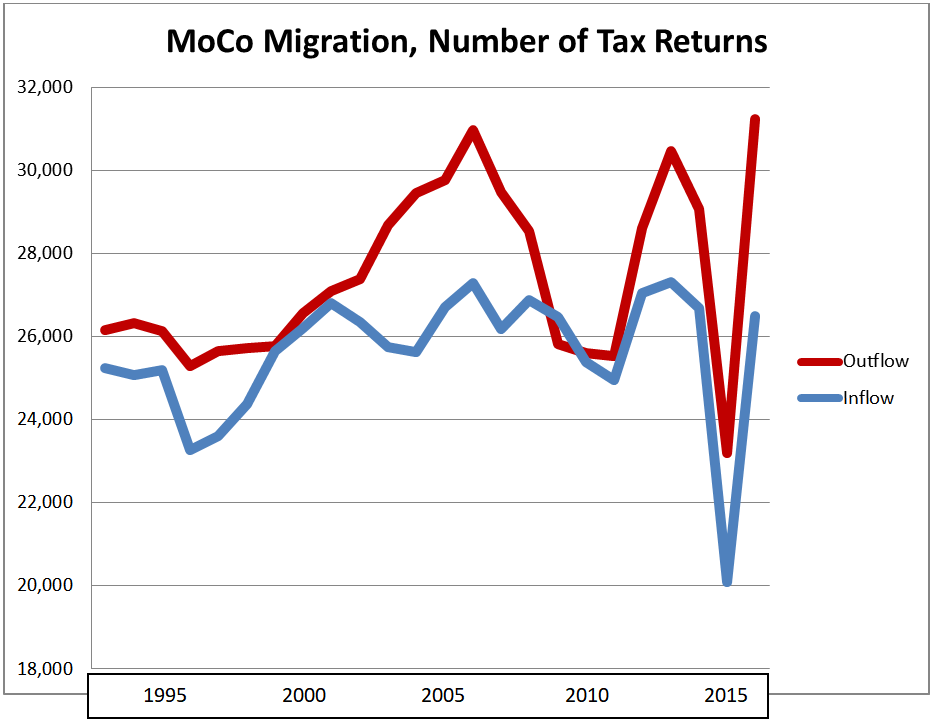
For most years, the number of tax returns leaving has exceeded the number of tax returns entering. The chief exceptions have occurred during economic downturns, especially in the aftermath of the Great Recession. We are skeptical of the data for 2015: there is no apparent explanation for the enormous drop in both inflow and outflow in that one year. We saw those drops in every local jurisdiction we examined and they did not seem to produce huge swings in net changes, as we will see.
Below is the net change of tax returns (inflow minus outflow).

The net migration of tax returns – inflow minus outflow – tends to shrink during recessions but it is almost always negative. Since 1993, there was only one year when inflow exceeded outflow – 2009, when tax return migration was +658. In 2016, outflow exceeded inflow by 4,748 returns – the worst year on record. The migration of exemptions, in and out, has followed similar patterns.
Now let’s look at the migration of adjusted gross income (AGI). The chart below shows the total AGI of taxpayers migrating into Montgomery County and out of Montgomery County, adjusted for inflation and measured in millions of 2016 dollars.
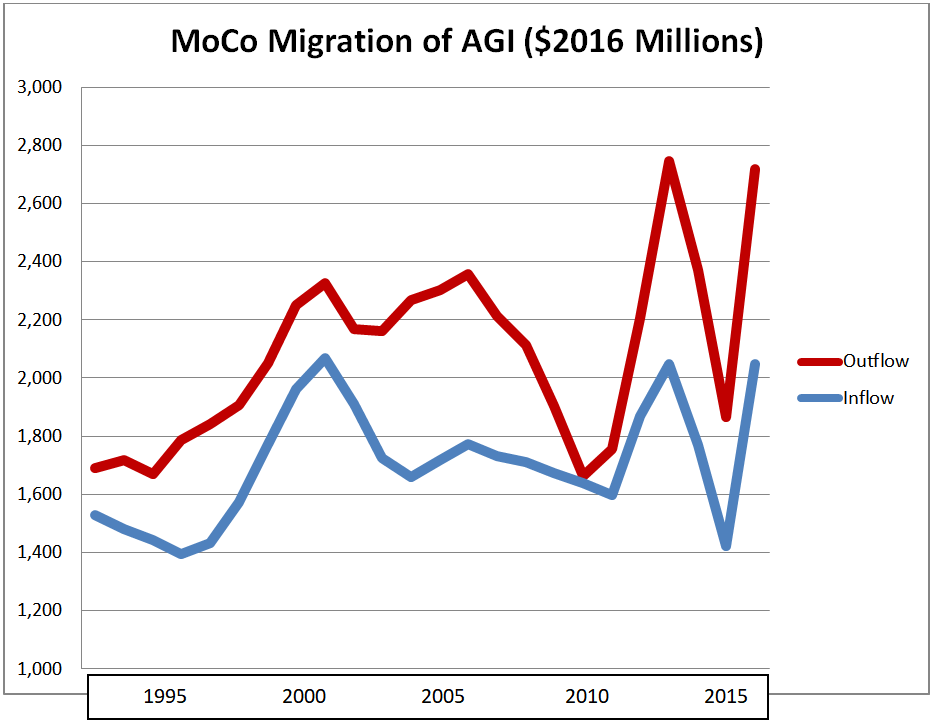
Outflow has exceeded inflow in every year. Note, once again, the fluky data for 2015. Below is the net change, adjusted for inflation, in millions of 2016 dollars.

Every year has seen a net loss of adjusted gross income. The year which came closest to a wash was 2010, when $24 million was lost. The worst losses on record were in 2004 ($608 million), 2013 ($697 million), 2014 ($601 million) and 2016 ($672 million). Over the five-year period of 2011 through 2016, $2.75 billion of taxpayer income left Montgomery County on net.
The IRS data tells one more story. Thousands of taxpayers enter MoCo and thousands leave MoCo every year. But on average, those who enter have lower adjusted gross incomes than those who leave. The chart below shows the average AGI of in-migrants and out-migrants in 2016 dollars.
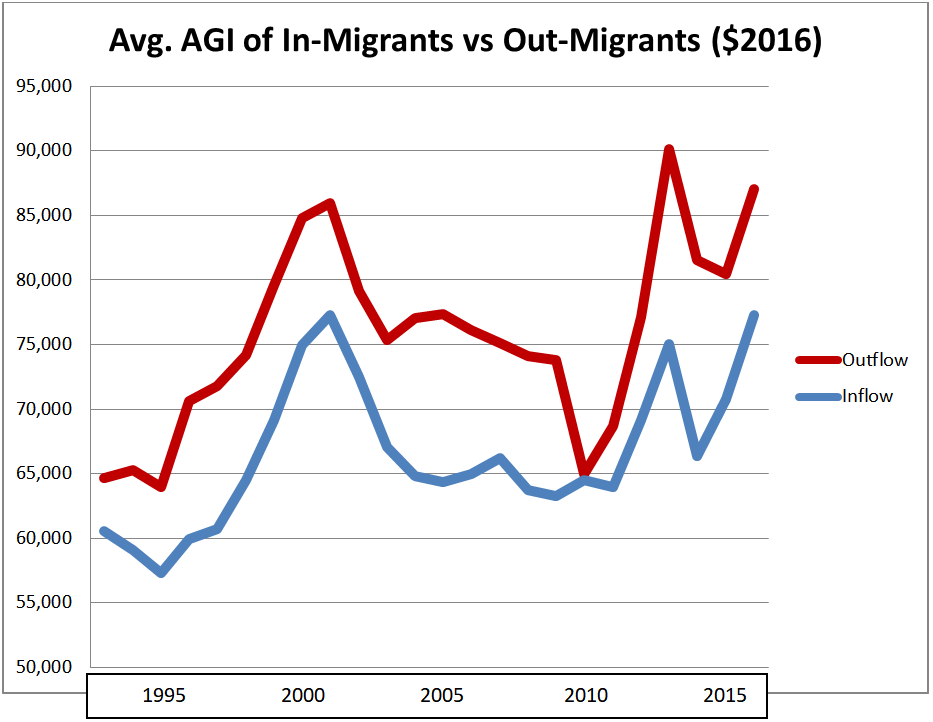
Since 1993, out-migrants have had greater adjusted gross incomes than in-migrants by an average of 14%. In the 2011 to 2016 period, the average AGI of in-migrants was $71,707 in 2016 dollars while the average AGI of out-migrants was $83,262 – a gap of 16%.
One can only imagine the impact on the county’s budget when hundreds of millions of dollars in taxpayer income leave every year.
Montgomery County is not the only jurisdiction in the region to see a net exodus of taxpayer income. We will examine how MoCo compares to its large neighbors in Part Three.
